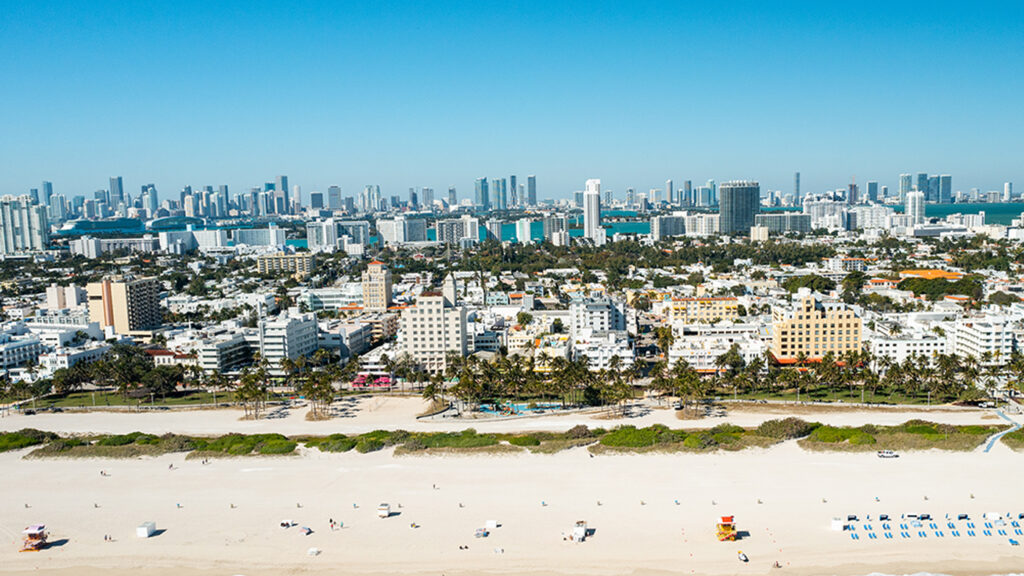
The Covid-19 pandemic, among many other factors discussed in this report, have propelled a mass corporate migration to Miami-Dade County. Companies and people alike have been enticed to the County’s low tax policies, looser Covid restrictions, economic incentives, and lower overall real estate costs.
Over the past year, momentum has been building and a clustering of technology, financial, and wealth management companies has taken formation creating one of the largest emerging fin-tech hubs in the nation. You can read more about this formation in our Q1 2021 Miami-Dade County Office Market Report.
In parts two through five, we analyzed the dynamics between four of Miami-Dade’s hottest office and luxury residential markets – Miami Beach, Coconut Grove, Brickell, and Downtown Miami. Join us in the final part of this six-part series as we draw conclusions using market comparison graphs for the office and residential markets discussed.
Office Market Comparison

- The prominent Brickell market outperformed the asking rental rates of the other markets discussed by at least $3 at all times. Brickell’s asking rental rates were unwavering before, during, and after the pandemic, not dropping below $63 per square foot at any point.
- Across all four markets, asking rental rates in Q1 2021 exceeded those of 2019 displaying resiliency and heightened demand post-Covid.
- Miami Beach experienced the greatest rent growth, of 10.2%, year-over-year in Q1 2021, reaching $56.66 per square foot. Limited viable office space, high land prices, and increased investor interest toward hotels or boutique condo projects boosted demand and contributed to the asking rent rebound.
- Of the four markets discussed, Downtown Miami offers the lowest asking rental rate of $50.35 per square foot though it had the second largest year-over-year rent growth as demand grows, encouraged by economic incentives and favorable tax laws.
- As a result of the pandemic, suburban markets become favorable in 2020; with Coconut Grove being the only suburban market explored in this series, it had the highest net absorption during the pandemic year of 2020 with tenants consistently renewing their leases.
Residential Market Comparison
- Every market discussed experienced Q1 2021 year-over-year increases in closed transactions. Downtown Miami had the largest increase of 233%, followed by Brickell’s 211% increase, Miami Beach was close behind at 203%, while Coconut Grove’s closed transaction only increased 27%.
- Closed transactions in the $3M-$5M range only increased year-over-year for Miami Beach in Q1 2021. Additionally, Miami Beach’s largest increase in closed transactions happened in this range, 625%.
- Closed transactions in the $5M+ range were the second largest year-over-year increase for Miami Beach in Q1 2021, reaching 523%. Downtown Miami was the only other market to see a Q1 2021 year-over-year increase in this range, reaching 50%.
The mass influx of residents and corporations have been driving thecommercial office and luxury residential markets in Miami-Dade County so far in 2021. In this series we explored four key markets and found that closed residential transactions in Miami Beach experienced year-over-year increases greater than 200% in three different price ranges. We also found that Miami Beach experienced the greatest office rent growth year-over-year, Coconut Grove posted the largest net absorption during the pandemic, and that Brickell consistently achieves asking rental rates of at least $60 per square foot. Additionally, we found that each market’s asking rental rate for Q1 2021 (post-Covid) exceeded its asking rental rate of 2019 (pre-Covid) demonstrating strong demand for office space propelled by increased in-migration. This series displays that our increasing population drives growth in our residential markets and translates to growth in our commercial office markets.
Download the full report here.
Also read: Part One: Overview | Part Two: Miami Beach | Part Three: Coconut Grove | Part Four: Brickell | Part Five: Downtown Miami

 Verity Mosquera

 Sheena Gohil
 Bob Shanahan
 Dougal Jeppe
 Kai Shane
 Bret Swango, CFA
 Michelle Cleverdon
 Aaron Jodka