 Aaron Jodka
- Not all centers are created equal, as foot-traffic data based on cell phone tracking can showcase.
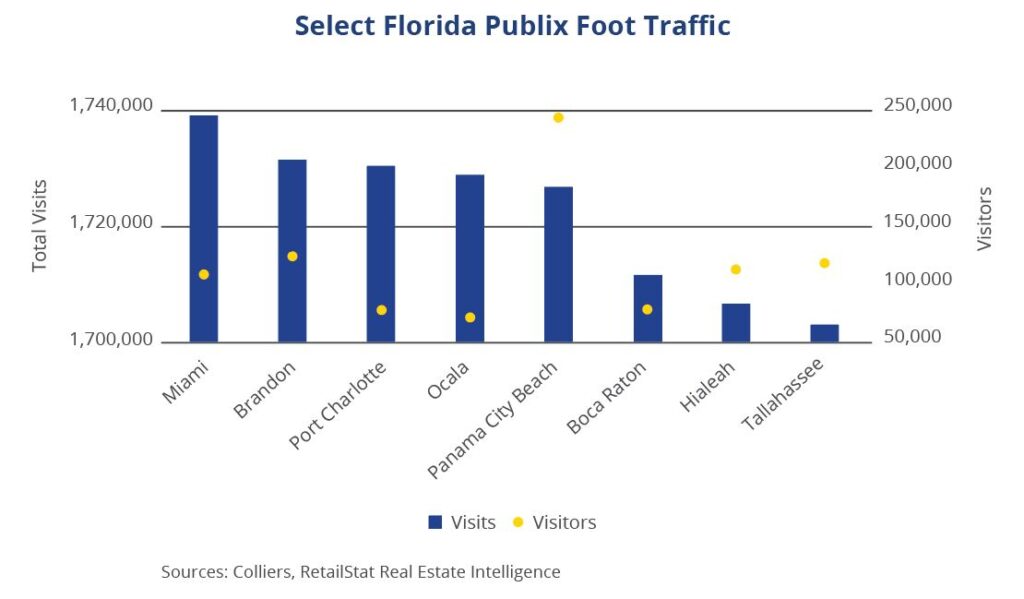
- Tracking eight Publix stores in Florida that receive roughly 1.7 million visits per year, we found clear differences in the drivers of visits.
- Meanwhile, the top five Publix for total visits can also show variance, depending on whether the stores drive traffic or benefit from the activity of co-tenants.
- Understanding the dynamics within centers can help investors uncover better values and understand inherent risks for portfolios.
Publix is a popular grocery chain in the Southeast, and nearly 60% of its stores in Florida receive more than one million visits annually. Because grocery-anchored centers are the retail-investor darling, we have analyzed Publix stores in Florida to uncover differences between stores and centers using cell phone data to look at foot traffic. Cell phone data allows for a deeper understanding of who is going to the store and how frequently. Eight Publix in Florida have 1.70 million–1.74 million visits over the past year ended in May; in theory, these stores and centers should be priced similarly. However, foot-traffic data may reveal stores’ differing risk profiles.
Within this set of stores, total visits are essentially equal, around 1.70 million, but not the number of individual visitors. The Publix at Ocean Park Pavilion in Panama City Beach, a tourist-driven destination, has 244,000 visitors, but the average visit frequency (visits divided by visitors) is just seven. Contrast that to the store at Park View Commons in Ocala, which has nearly the same total traffic but from 71,000 visitors, for a visit frequency above 24. Comparing trailing 12-month traffic through May, to full-year 2021, the Ocala Publix is up about 7%, while Panama City Beach visits increased 54%, thanks to the return of tourism. Foot-traffic data clearly shows great differences in visitor frequency, and consistency, based on location.
Along with the frequency of visits, tenant mix also matters. Data from the five most-visited Publix in the state range from 1.83 million visits to 2.05 million. In the case of the Publix at the Shoppes at Paradise Point in Fort Walton Beach, the number one store by visits, the Publix store drives 83% of the center’s visits. Co-tenants include Great Clips, Painting with a Twist, Joy Massage, a nail salon, Waffle House, and a liquor store. Conversely, the Publix at Collier Commons in Land O’ Lakes accounts for 41% of the center’s traffic. Other tenants in this center include a Belk Outlet, a nail salon, Planet Smoothie, H&R Block, a dry cleaner, and fitness spaces and other dining options. While a grocery-anchored center and a power center would be and should be priced differently, it is important to understand the drivers of foot traffic when underwriting investments.
Investors and tenants can use this granular data in addition to typical metrics, including vehicle traffic, incomes/buying power, and lease rolls to uncover opportunities for both portfolios and businesses. While there’s more to investing than simply counting foot traffic, the additional insight can help investors identify potential value and better understand inherent risks or volatility within a specific center.

 Nicole Larson