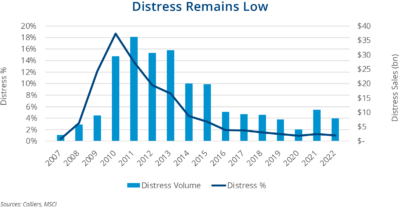
- MSCI reported $7.9 billion of distress sales in 2022.
- This figure decreased from 2021 when $10.9 billion of distress traded.
- Distress peaked in 2010 at 18.7% of volume.
- Absolute distress sales peaked in 2011 at $36.2 billion.
- Investors are waiting for an impending wave of defaults and distress, which will likely dwarf previous highs.
Recently released distress figures from MSCI show the calm before the storm. These figures haven’t been a big story in recent years. Only 1% of volume in 2022 was distress related; the last time distress topped 2% was in 2014. In the aftermath of the Global Financial Crisis (GFC), an average of $32 billion in distress sales took place from 2010-2013, peaking at $36.2 billion in 2011. However, distress lags. Lehman Brothers collapsed in 2008, causing the GFC to spiral. Today’s market disruptions will lead to opportunities in the years ahead.

ow much distress will come to market is still an open question. More than $2 trillion of debt maturities are due by 2027, per MSCI estimates. Unlike the years after the GFC, interest rates are higher as the U.S. and the broader global economy are battling inflation. This scenario prevents the Fed from cutting rates to zero or providing substantial quantitative easing. Plus, the Fed’s balance sheet is significantly larger than in the pre-GFC days. “Kick the can” and “extend and pretend” were common refrains in the years following the GFC. The banking industry has been volatile of late, and lending is likely to pull back as a result. This will make refinancing maturing debt more challenging.
CMBS delinquency rates remain low, even though they have recently increased. Special servicing rates are also on the rise and are higher than delinquencies, a clear indicator of impending distress. A record amount of opportunistic, value-add, and debt capital is waiting in the wings, ready to pounce on what is likely to be a record amount of future distress.

 Colliers Insights Team

 Steig Seaward

