 Colliers Insights Team
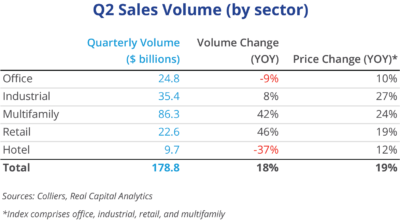
- Sales volumes set another record in Q2, but that is unlikely to continue in Q3.
- Our experts note that deals are being re-traded frequently, suggesting that transactional pricing will adjust in the quarters ahead.
- Transactional cap rates have yet to move meaningfully, though industrial rates rose slightly.
- Multifamily drove nearly 50% of all first-half volume. As multifamily goes, so goes the broader market.
- Higher borrowing costs and still-low cap rates create a negative leverage situation, which buyers and sellers are still working through.
Investment sales volume remained strong in Q2, coming in 18% higher than one year ago, setting a new all-time record for sales volume over a four-quarter period, bringing in more than $905 billion in the past year. But the pace of annual growth has slowed, transactions are taking longer to complete, and re-trades are becoming common. Transactional data from Real Capital Analytics has yet to show meaningful changes in pricing (all property type pricing appreciated in Q2, save for hotel). However, our boots on the ground suggest that pricing has fallen across asset classes.
Office
Of the big four asset classes, office is facing the largest slowdown in sales volume, down 9% over a year ago and with the slowest appreciation. Transactional cap rates are up 10 basis points over Q1 rates, while the smoother hedonic pricing model shows continued cap rate compression. Office sales volume has fallen for the last two quarters (Q1 declines are the norm after a rush at year-end), and sustained elevated inflation is causing investors to reprice long-term leased assets. Year-to-date, the top five investment sales markets are Manhattan, with volume up nearly 200%; Los Angeles; Seattle; Dallas; and Boston, where sales are declining because of fewer monster life science deals. Dallas posted the strongest first-half office sales volume in its history.
Industrial
Industrial sales volume was down 10% from Q1, but once future updates to RCA’s sales series are incorporated, volume is likely to range from flat to up. Industrial’s $35.3 billion in volume was the highest ever in a second quarter. Pricing continues to rise, and industrial had the strongest quarterly change of any asset type. Transactional cap rates bumped up 20 basis points, while the hedonic series showed additional compression. This suggests that the market is at an inflection point: recently closed deals still mostly reflect earlier price momentum and market conditions. Deals on the market today are likely to face lower pricing proceeds, which will be reflected in future RCA data cuts. Twenty of the top 25 markets for sales volume this year set a new first-half record.
Multifamily
Multifamily sales continue to drive the overall market. Volume was up 26.3% quarter-over-quarter, the strongest of any asset class. Year-over-year gains are still strong, up 42% (second to retail), though they too are slowing. Both transactional and the hedonic pricing series show cap rate compression in Q2. This is likely to change in the near future, as borrowing costs higher than cap rates are causing a negative leverage situation. Cap rates were due to rise this year anyway, as strong NOI performance was pushing them up, and new buyers could not underwrite the kind of growth seen in recent quarters. And as multifamily goes, so goes the overall market: it has driven nearly half of all sales volume this year. As happened with industrial, 20 of the top 25 sales markets year-to-date set a first-half volume record.
Retail
Retail has had a strong run through the first half of the year. Volume is up quarter-to-quarter and shows the strongest year-over-year gains of all asset classes. Transactional cap rates have flattened, while the hedonic series continues to compress. Cap rates are structurally higher in this asset class than in multifamily or industrial, which allows buyers more wiggle room in the face of increased borrowing costs. Plus, U.S. consumer spending continues to be strong, supporting retail. Inflation does eat into this, however, and concerns investors. This should be temporary, as market expectations are for inflation to ease in the quarters ahead. Through the year’s first half, eight markets have set new sales records, led by several on the West Coast: Sacramento, Seattle, East Bay, San Jose, and Orange County.
Hotel
Hotel sales slumped in Q2, but this isn’t the full story. Volume fell 23.4% from that in Q1 and is down 37% over the past year. That second metric reflects a lack of entity-level transactions (one year ago Extended Stay America went private, sending volume soaring). Single-asset trades rose slightly in Q2 and were up 40% in the first half of the year. Drive-to destinations remain popular, with markets such as Fort Myers cracking the top 10 for year-to-date sales volume. Last year the Fort Myers market was outside the top 25 and in 2020 was 86th for volume. Dallas leads the nation in sales volume, followed by Manhattan, Austin, Nashville, and Los Angeles. Dallas, Austin, Nashville, Fort Myers, and Napa, CA, set first-half records for sales volume.
Download the report.

 Joe Fetterman
 Jeffrey Myers
 David Burden
 Frank Petz
 Steig Seaward
