 Colliers Insights Team
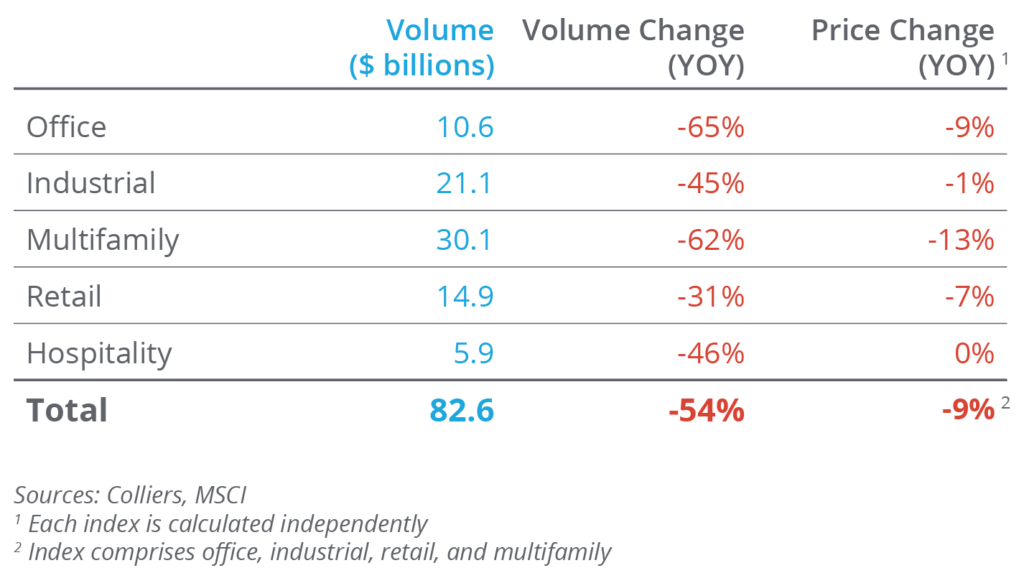
- Sales volume of $82.6 billion was down 54% from last year.
- Third-quarter volume fell slightly from Q2, though year-over-year declines are leveling off.
- Retail is the only asset class to post a quarter-over-quarter sales increase.
- MSCI reports that price declines are subsiding. Whether this holds is still to be determined.
- Continued volatility in the 10-year Treasury and war in the Middle East has investors on edge.
After volume increased in Q2, the market reversed course, and sales decreased in Q3. Seasonality wasn’t a factor, as volume typically rises about 10% in Q3. However, it does demonstrate the continued strain on the market overall. Higher interest rates in the quarter and an acceptance of a ‘higher for longer’ environment have slowed deal volume, with others falling out of contract in recent weeks. Deals still need to get done, so while $82.6 billion is low relative to history, it is still 2x-6x the amount transacted in 2008-early 2010.
Office
Office volume has generally fallen since the end of 2021 and is ahead of the broader market. Investors must return to the beginning of 2010 for figures to be lower than Q3’s $10.6 billion. This trend is heavily driven by a lack of CBD sales, down 76% over the past year. Based on quarterly average pricing, a function of what is trading, values are back to 2012 levels.
Industrial
Like other asset classes, higher interest rates have been weighing on activity. Cap rates are rising, and rent growth is easing. However, industrial volume is in line with pre-COVID levels. In Q3, $21.1 billion traded, slightly ahead of the 2014-2019 quarterly sales average. While this is a sizeable decline from the 2021-2022 heyday, industrial is the most functionally operating asset class.
Multifamily
Multifamily remains the most liquid asset class overall, with Q3 volume totaling $30.1 billion. In addition, multifamily accounted for 36.5% of all sales volume this quarter, well ahead of its pre-COVID norm of 31.8%. At the height of the market, multifamily regularly accounted for 40% or more of volume, suggesting a sense of normalcy is returning. Cap rates are rising and, per quarterly averages, are back to 2019 levels.
Retail
Retail is the only asset class to post a sales increase in Q3. Entity-level transactions were the main driver; they were few and far between in other asset classes. Overall retail volume is restrained, with just shy of $15 billion trading in Q3, 24% below its 2014-2019 quarterly sales average. That said, the number of trades in Q3 was broadly aligned with quarterly activity in the pre-COVID era.
Hospitality
Hospitality volume fell 7% quarter-over-quarter to $5.9 billion. Overall volume has been relatively consistent through the year’s first three quarters. When comparing recent activity to 2014-2019, volume is limited. During that time, an average of $9.7 billion traded per quarter. Still-strong fundamentals make hospitality an intriguing acquisition target. Given the higher going-in rate, average cap rates haven’t moved as much as those in other asset classes.

 Steig Seaward

 Joe Fetterman
 Jeffrey Myers
 David Burden
 Frank Petz