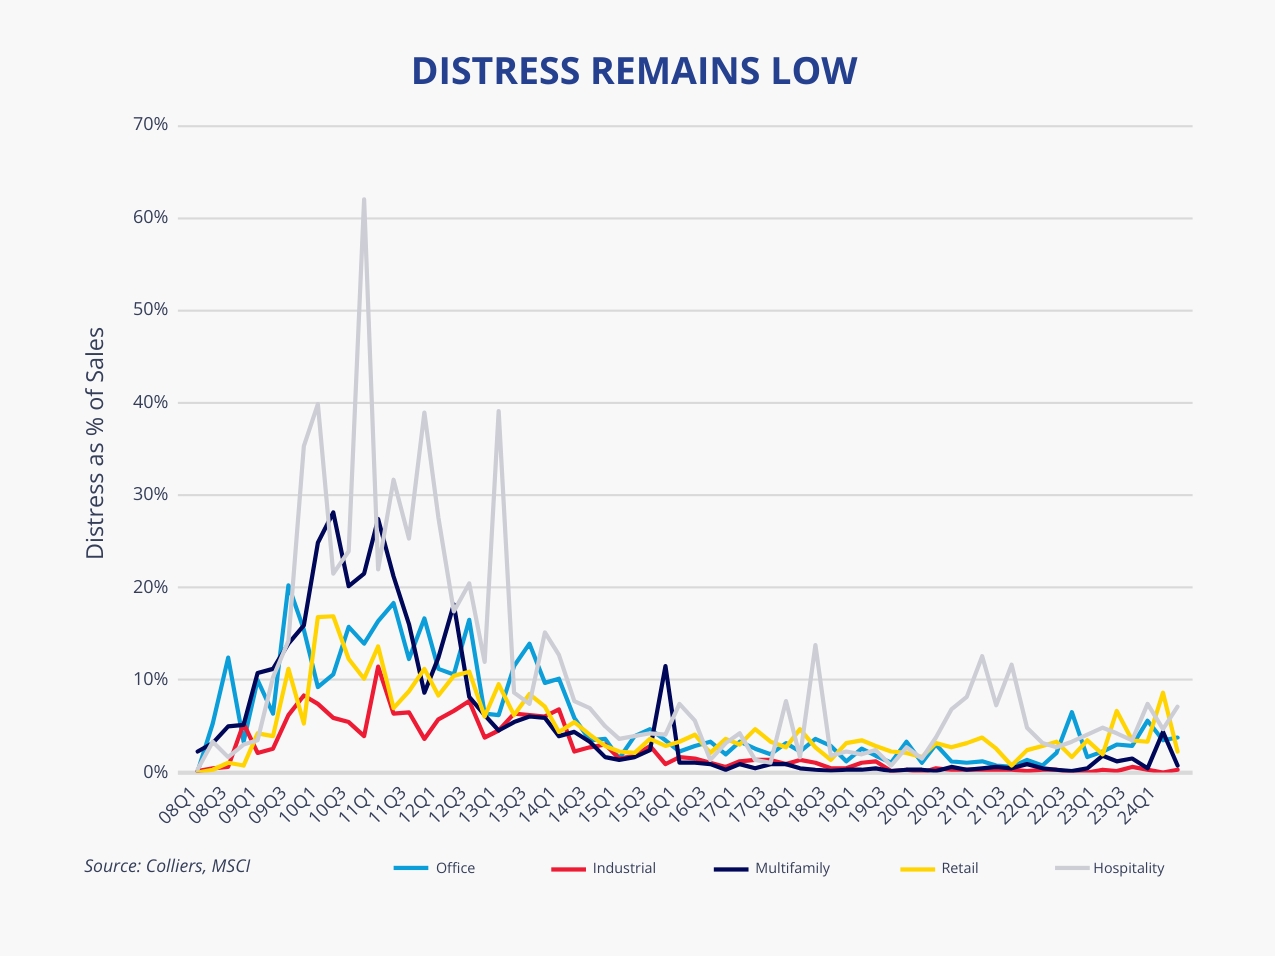
- Headlines create the impression that distress is everywhere.
- Sales data tells a different story.
- Since the beginning of 2023, distress sales have averaged $2.1 billion per quarter.
- This figure is below the quarterly average of $2.2 billion from 2017-2019.
- There is potential for future distress, so investors should be ready to pounce.
Distress looks to be a viable investment target. Numerous properties have sold at steep discounts to their previous sale price and well below replacement costs. In addition, debt maturities will result in opportunities throughout the capital stack. However, when looking at actual sales, distress has been limited since the pandemic’s start, especially compared to the levels experienced during the Global Financial Crisis. MSCI reports that distress sales declined in Q2 compared to Q1 and, since 2023, have averaged $2.1 billion per quarter. This figure is below the quarterly average pre-pandemic when $2.2 billion of distress traded between 2017-2019. Based on this metric, distress isn’t widespread; it’s normal. However, it is on the rise, with newly troubled loans running at a pace 5x pre-pandemic.
 Aaron Jodka
There is potential for future distress, so investors should be prepared to capitalize on upcoming opportunities.

By asset class, hospitality leads in distress as a share of total activity at 7.2%, while office ranks second at 3.8%. Industrial has shown very little distress to date, with only $1.7 billion outstanding. Comparatively, office leads in outstanding distress in Q2 at $41 billion. However, distress will emerge across all asset classes. MSCI’s potential distress figures show that multifamily has the highest share at nearly $81 billion. Office follows at close to $67 billion, while retail, hospitality, and industrial are clustered together, totaling between $32 billion and $36 billion. At the market level, Manhattan leads with $17.2 billion in current distress, followed by San Francisco and Chicago at $7.2 billion each. Los Angeles and the New York City Boroughs round out the top five at $4.4 billion and $3.7 billion, respectively.
It’s important to note that differences exist from market to market. For example, although San Francisco and Chicago have similar totals, the factors driving them vary significantly. Chicago is propelled by office distress, while San Francisco is dominated by multifamily.
Understanding where distress is today and where it will emerge in the future will be crucial in helping investors unlock acquisition targets.


 Miles Rodnan
 Andrew Wellman
 Matt Nelson