 Colliers Insights Team
- NCREIF released an expanded NPI data series with new subcategories, providing more clarity on the office market.
- These subcategories have different pricing experiences.
- While all have shown a decline in recent quarters, some stand out when looking at values since 2020 Q1.
- Analyzing long-term trends across these series will allow investors better visibility into portfolio construction and risk/return trade-offs.
- Data is also available at the market level.
Determining office values can be challenging today. Some assets are trading at significant discounts to their last sales price, but these properties generally have lower occupancy. A disparity remains between major price indices from CoStar, Green Street, MSCI, NAREIT, and NCREIF. While all show that asset values are down, their rates vary widely. NCREIF, in its Q1 data release, expanded upon its NPI (NCREIF Property Index), allowing better visibility into the office sector’s performance. The office sector is now segmented into the following categories: Central Business District (CBD), Secondary Business District, Suburban, Urban, Life Science, and Medical Office. Values fell across subsets in Q1 but were generally less severe than the quarter or quarters prior. The lone exception to this was Life Science, where value declines accelerated.
Analyzing long-term trends will allow investors better visibility into portfolio construction and risk/return trade-offs.
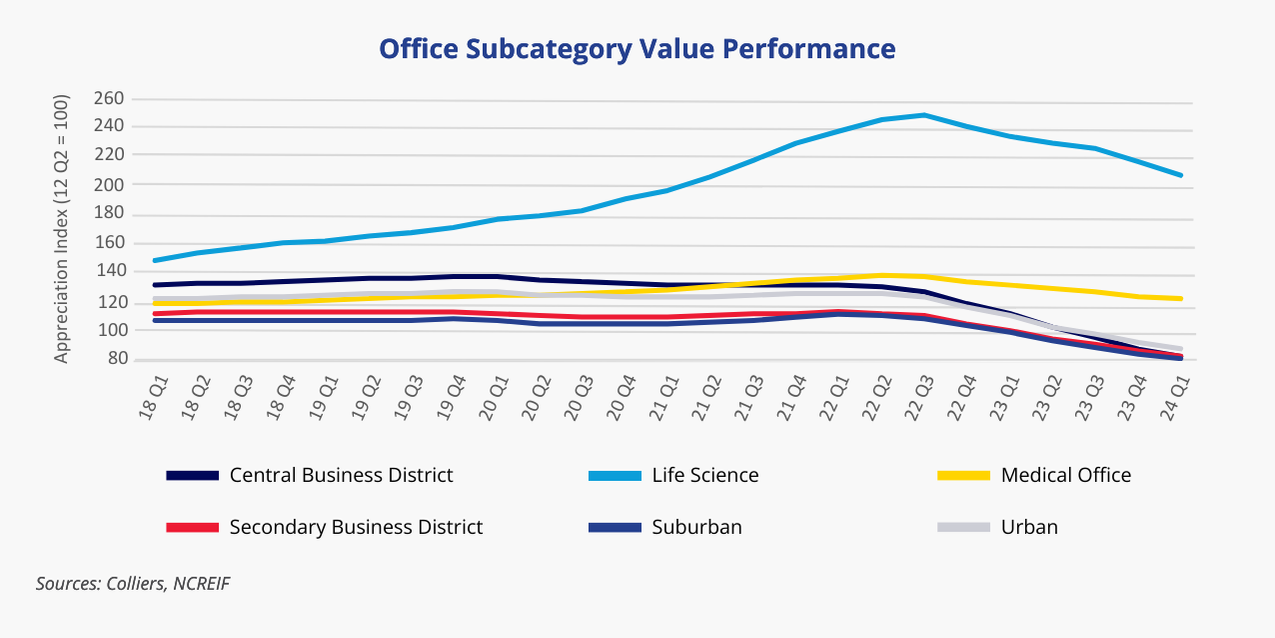
These office subsets have not performed identically, their value peaks have varied, and their declines have not been uniform, as shown in the visual above. CBD office has been hit the hardest, which shouldn’t come as a surprise. Values there are down 40%. On the other hand, Medical Office has experienced a 12% price decline, with values growing nine full quarters longer than those of CBD properties. This analysis looks at the peak-to-current value change; most investors did not buy at the peak.
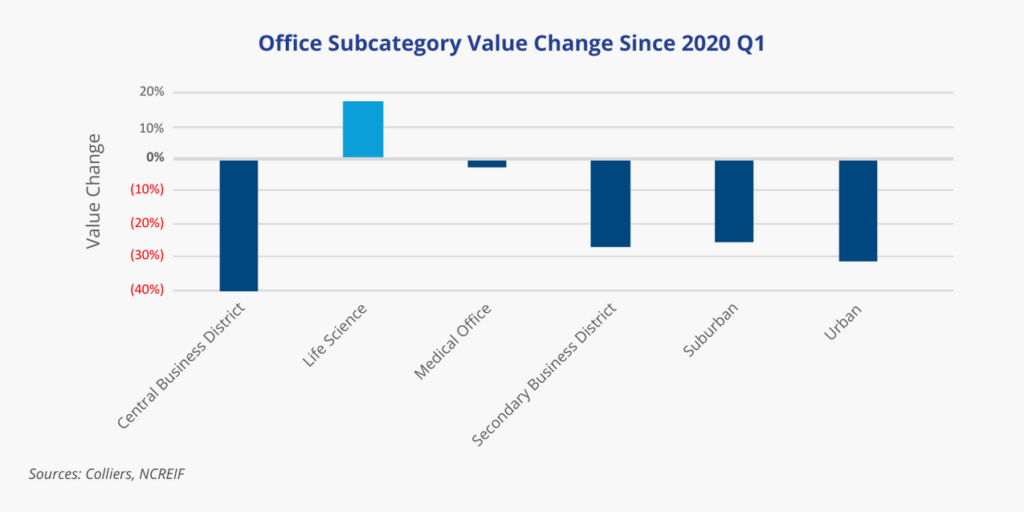
Using the pandemic’s start as a demarcation event, we can see how these office subsets have performed. CBD office peaked in 2020 Q1, so its 40% decline noted above also holds in this analysis. Life Science values are still up 17%, while Medical Office values are down just 2%. The other sets show a similar performance of declines between 25% and 31%. The ability to further analyze asset classes with this expanded NPI will allow investors to better understand risk/return trade-offs and portfolio optimization.

 Steig Seaward

 Marianne Skorupski