 Anthony Burnett
Economic incentives are increasingly pivotal in guiding industries toward growth and innovation. Grasping the distribution and impact of these incentives across different sectors offers critical insights into the trends shaping the United States’ economy. In the second blog post of this series, we dive deeper into the incentive trends from 2023, specifically the allocation of incentives across different industry sectors, and evaluate their implications.
Deals by Industry Sector
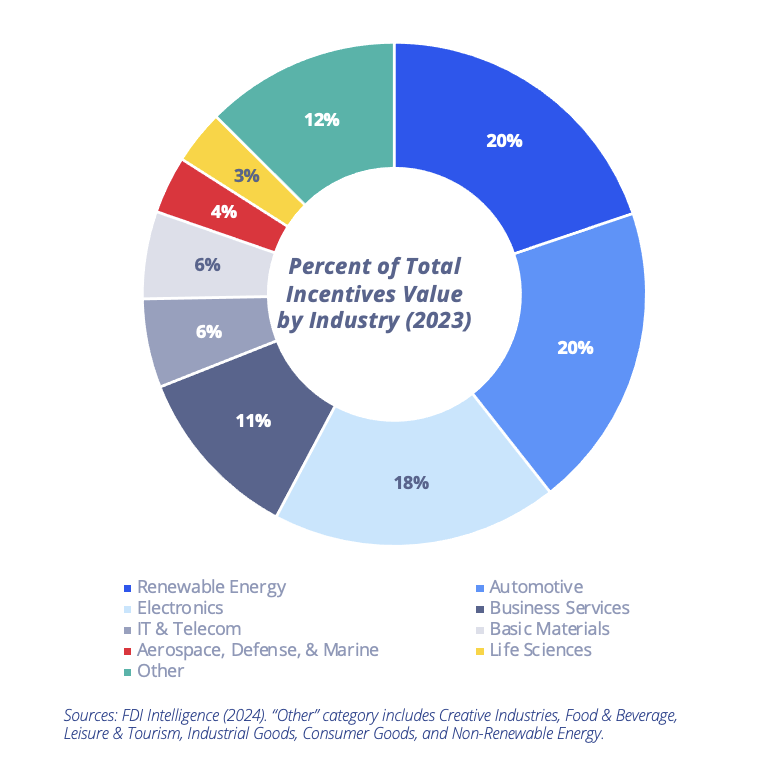
In 2023, the distribution of incentives showcased a strategic focus on sectors driving progress and sustainability throughout America. Renewable Energy and Automotive, two of the strongest growth sectors from foreign and domestic investment, each accounted for 20% (total of 40%) of all incentives in 2023, with both sectors receiving roughly $4.7 billion in incentives. The Electronics industry finished a close second at 18%, receiving over $4.3 billion in incentives, down from a ten-year high of $15.7 billion in 2022.
Federal initiatives such as the Inflation Reduction Act and the CHIPS program played crucial roles in supporting these sectors. Industries like IT & Telecom, Life Sciences, and Aerospace, Defense, & Marine witnessed noteworthy increases in incentives, signaling a concerted effort to strengthen technological innovation and national security.
Average Incentive Value per Capex: by Industry Sector
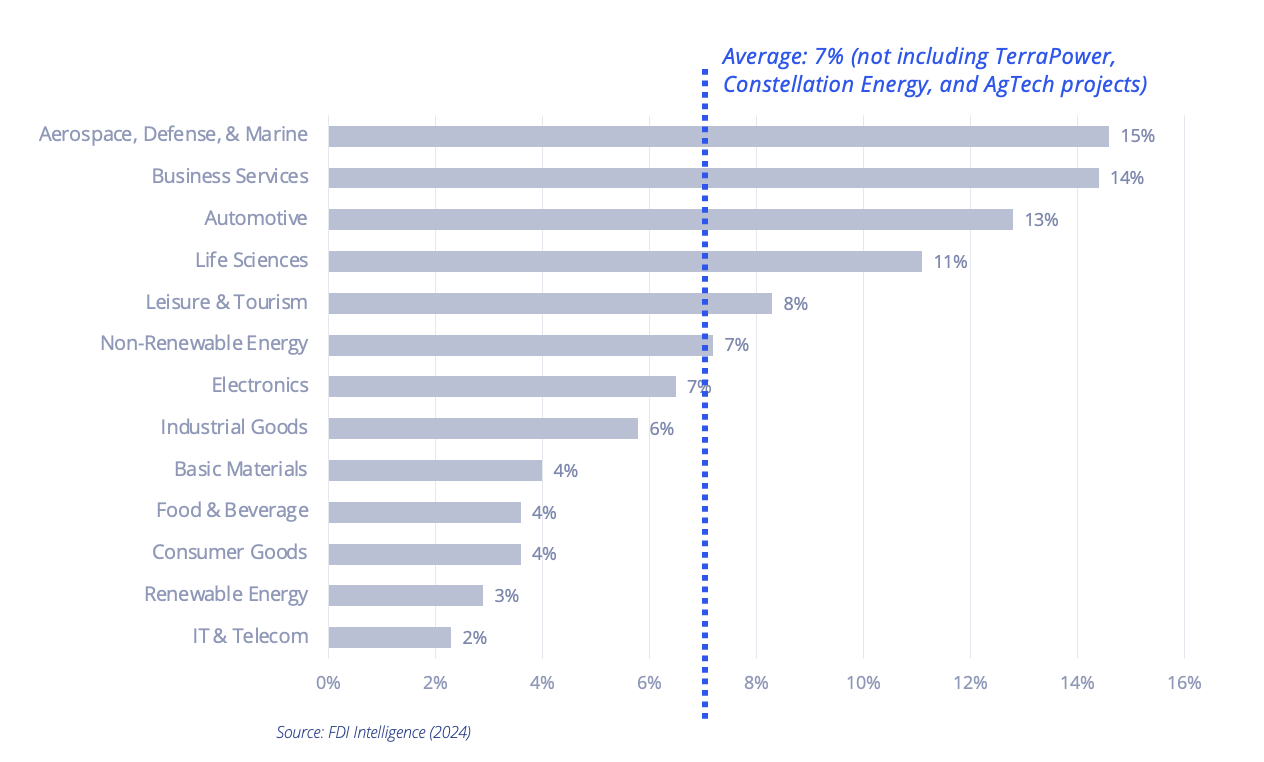
Peeling back a layer of the incentive onion allows an examination of average incentive value as a percentage of capital expenditure (capex), revealing interesting findings. The average incentive value as a percent of capex was greatest for projects in the Aerospace, Defense, & Marine industry in 2023, followed by Business Services and Automotive projects. Across all industries, as shown in the graph below, the average incentive award was equal to seven percent (7%) of a project’s total capital expenditure. These incentives took the form of cash grants, loans, tax abatements, job credits, or other benefits that help offset upfront and recurring project costs.
However, it’s important to recognize the outliers and subtleties within the data. For example, projects executed by TerraPower, Constellation Energy, and AgTech OS in 2023 received such significant incentive packages compared to capital expenditure and/or job creation that they distorted the average incentive values per capex and per job. Therefore, Colliers removed them from the analysis below. By excluding significant outliers in the Renewable Energy and the Electronics sectors, we ensure a more accurate analysis, allowing for a nuanced understanding of how incentives are distributed.
2023 Average Incentive Value Per Job: By Industry Sector
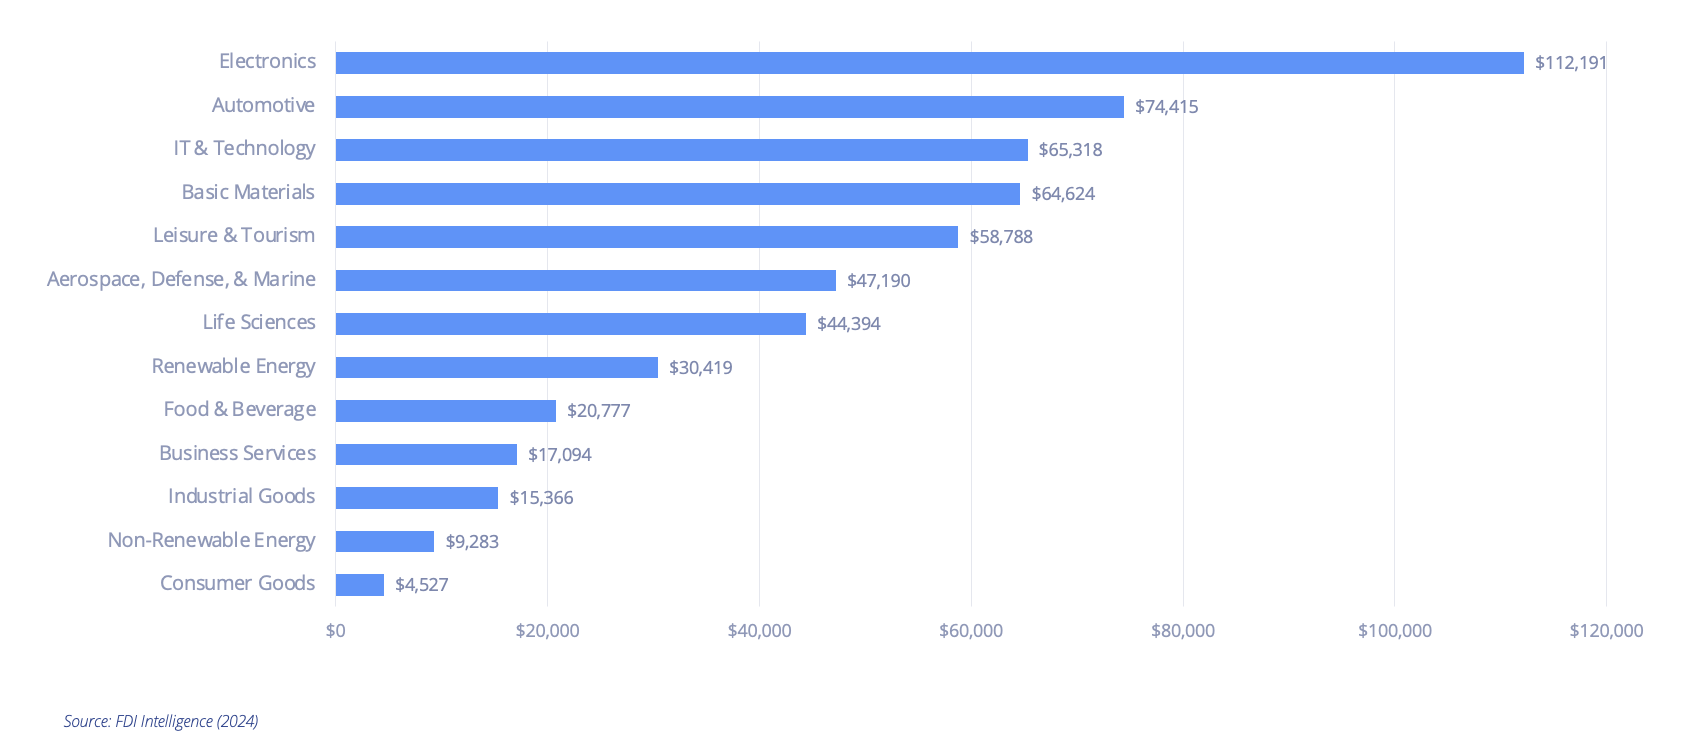
Incentives per job provide a different metric for assessing the effectiveness of incentive programs in creating employment opportunities and promoting economic growth. Electronics led all industries with an average of $112,000 in incentives per job, as shown below. Notably, a Redwood Materials project based in Nevada secured roughly $1 Million in incentives per job. The Automotive industry also secured significant incentives, with an average of $74,000 per job. However, incentives per job dropped for both the Electronics and the Automotive sectors from 2022 to 2023. Life Sciences and IT & Telecom showed the most significant year-over-year increase in incentives per job, with 891% growth and 491% growth, respectively. Both sectors featured projects that received over $1 million in incentives per job. Major expansions and new industries in these sectors are driving forces in the U.S. economy; therefore, federal, state, and local communities are incentivizing these companies to generate jobs and revenue.
2023 in Review – Industry Activity
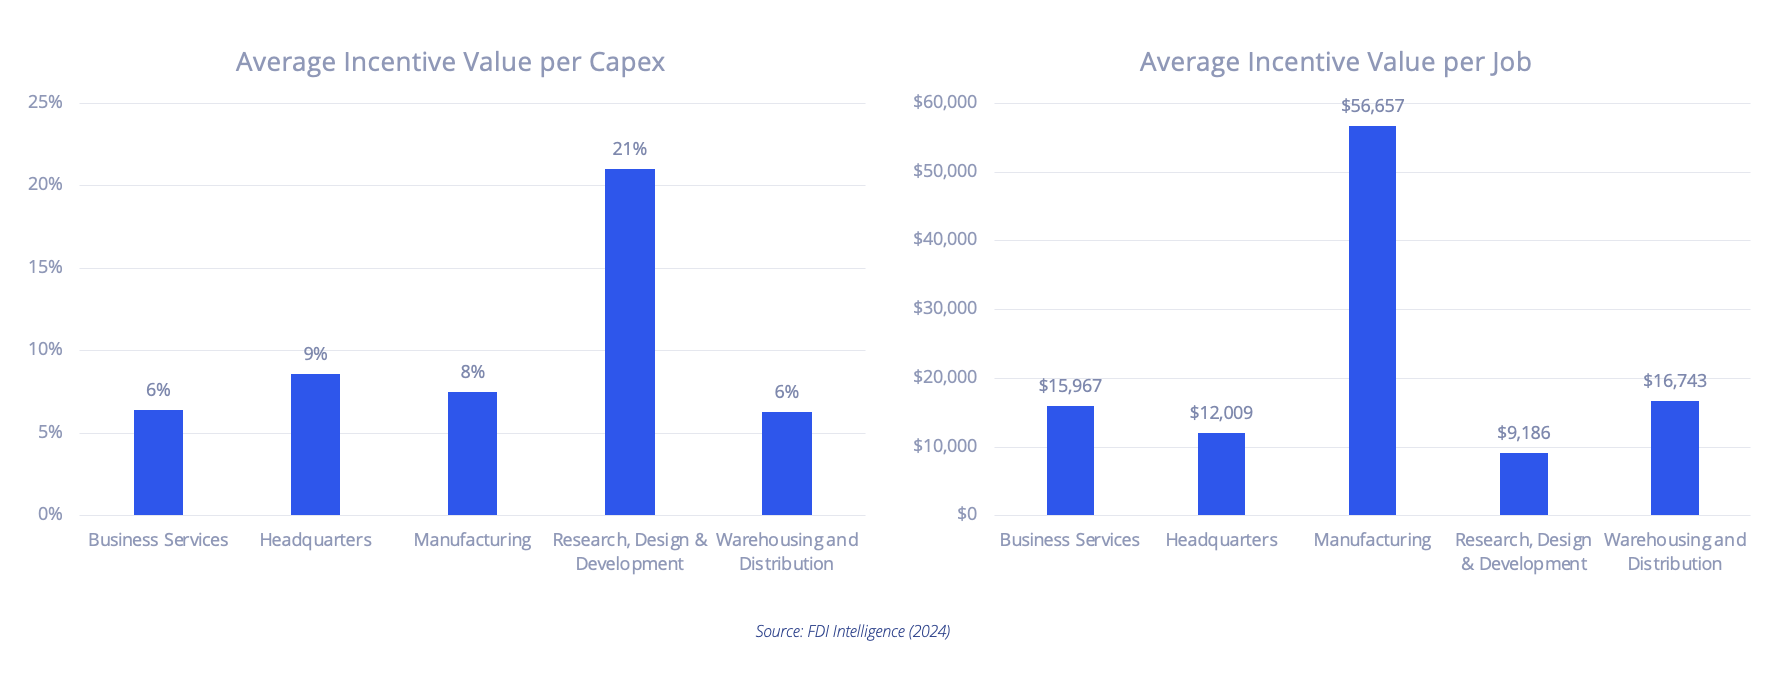
In 2023, Research, Design, and Development activities secured the highest value of incentives as a percentage of capex (21%), as shown in the first graph below. This was an increase from 14% in 2022 and was primarily fueled by substantial incentives granted to RTI Laboratories, Volkswagen, and various motion picture projects. Additionally, incentives as a percentage of capex rose by one percentage point for Warehousing and Distribution projects, signaling the slowdown from the meteoric real estate growth in distribution facilities following the COVID-19 Pandemic. Moreover, Business Services also experienced a three percentage point drop compared to the previous year, reaching a ten-year low in 2023. The slowdown in Business Services also mirrors the continued office real estate epidemic, reflected in record office vacancies across the U.S.
Manufacturing projects boasted the highest average incentive value per job in 2023, exceeding $56,000 as shown in the second graph. However, Manufacturing saw a decline from approximately $98,000 in 2022. As mentioned in our previous article, manufacturing onshoring and reshoring from domestic and foreign entities are still strong across the country. On the other hand, Business Services, Headquarters, Warehousing and Distribution witnessed year-over-year incentives per job increases, though the totals are much lower than manufacturing. Something significant is the fact that both Business Services and Warehousing and Distribution sectors reached ten-year highs for average incentive value per job in 2023. Again, it is important to note that this analysis excludes TerraPower, Constellation, and AgTech OS to provide a more representative reflection of averages.
The trends of 2023 highlight the complex relationship between economic incentives and industry growth. As we navigate the intricacies of economic expansion in the United States, it’s crucial to fully grasp these trends. This understanding is essential for companies making informed strategic decisions. The information provides a comprehensive look at industries and activities that we wish to grow and support at the local, state, and federal levels. Learn more here.

 Don Moss
 Monty Turner
 Marianne Skorupski
 Mike Mixer
 Amel Benha
 Juan E. Rose III
 Matt Stater