Bobby Shanahan
 Sheena Gohil
 Dougal Jeppe
Past the midpoint of 2025, office demand is quietly gaining momentum in certain markets based on the return to office as high-quality space becomes harder to find and new construction remains limited.
Below, we explore the key trends shaping the market from occupiers’ perspectives regarding new construction and top-quality space.
Big commitments could be in pipeline in the Big Apple
The Wall Street Journal recently reported that a large consulting firm committed to a new lease of 800,000 square feet at 70 Hudson Yards on Manhattan’s west side. While the transaction has not yet closed, this new 1.1 million-square-foot tower, developed by Related Cos., would be the largest ground-up office project to break ground nationwide in more than five years if the project is committed to, with excavation work already underway.
This development furthers the trend of flight to quality and reinforces what today’s tenants are seeking: new construction, flexible and efficient floor plates, transit access, amenities, and a modern workplace experience that drives talent back into the office. It also highlights the key factors facing both sides of the market: developers have been reluctant to start new construction projects without strong preleasing due to overall financing costs and construction risks, while occupiers may now become challenged in finding suitable relocation options in quality assets due to the focus on flight to quality.
Conversions catch up to the headlines
The Hudson Yards lease is one high-profile example, but it reflects a broader shift unfolding across Manhattan’s office landscape. Manhattan maintained its momentum from 2024 into the first half of 2025. In fact, Manhattan posted 11.4 million square feet of leasing activity in Q1 2025, its strongest quarter since Q4 2019. Furthermore, the Placer.ai Office Index from April 2025 showed New York’s foot traffic was only 5.5% below pre-pandemic levels. On average, Tuesdays and Wednesdays were busier than in April 2019.
As leasing activity picks up and tenants prioritize quality over cost, outdated office buildings are increasingly being targeted for repositioning or redevelopment. This trend has accelerated and could fundamentally reshape the fabric of our cities in the years ahead.
A prime example of this office-to-residential trend is 5 Times Square, which has been approved for conversion to 1,250 units. Construction on the 1.1 million-square-foot office building could start by year’s end. New York has proactively offered conversion incentives, making these projects more financially feasible.
According to a recent RentCafé report of Yardi Matrix data, there are 8,310 apartment units in New York’s office conversion pipeline, the highest in the nation and a 59% increase year-over-year. Nationwide, a record-high 70,700 apartment units are due to be completed this year from office conversions, nearly double from 2024. There has already been 8.76 million square feet taken out of the inventory in Manhattan since Q1 2021 due to confirmed conversions to non-office uses. Other uses like hotels and self-storage are gaining traction, though not at the same scale as residential conversions.
Limited new construction on the horizon
While conversion projects command the headlines, the lack of new office construction continues to fall under the radar. Though this might not seem like a glaring issue given the trends around hybrid work and the vacancy facing most markets, the growing demand for Class A+ (Trophy) space requires new space to be built in the future.
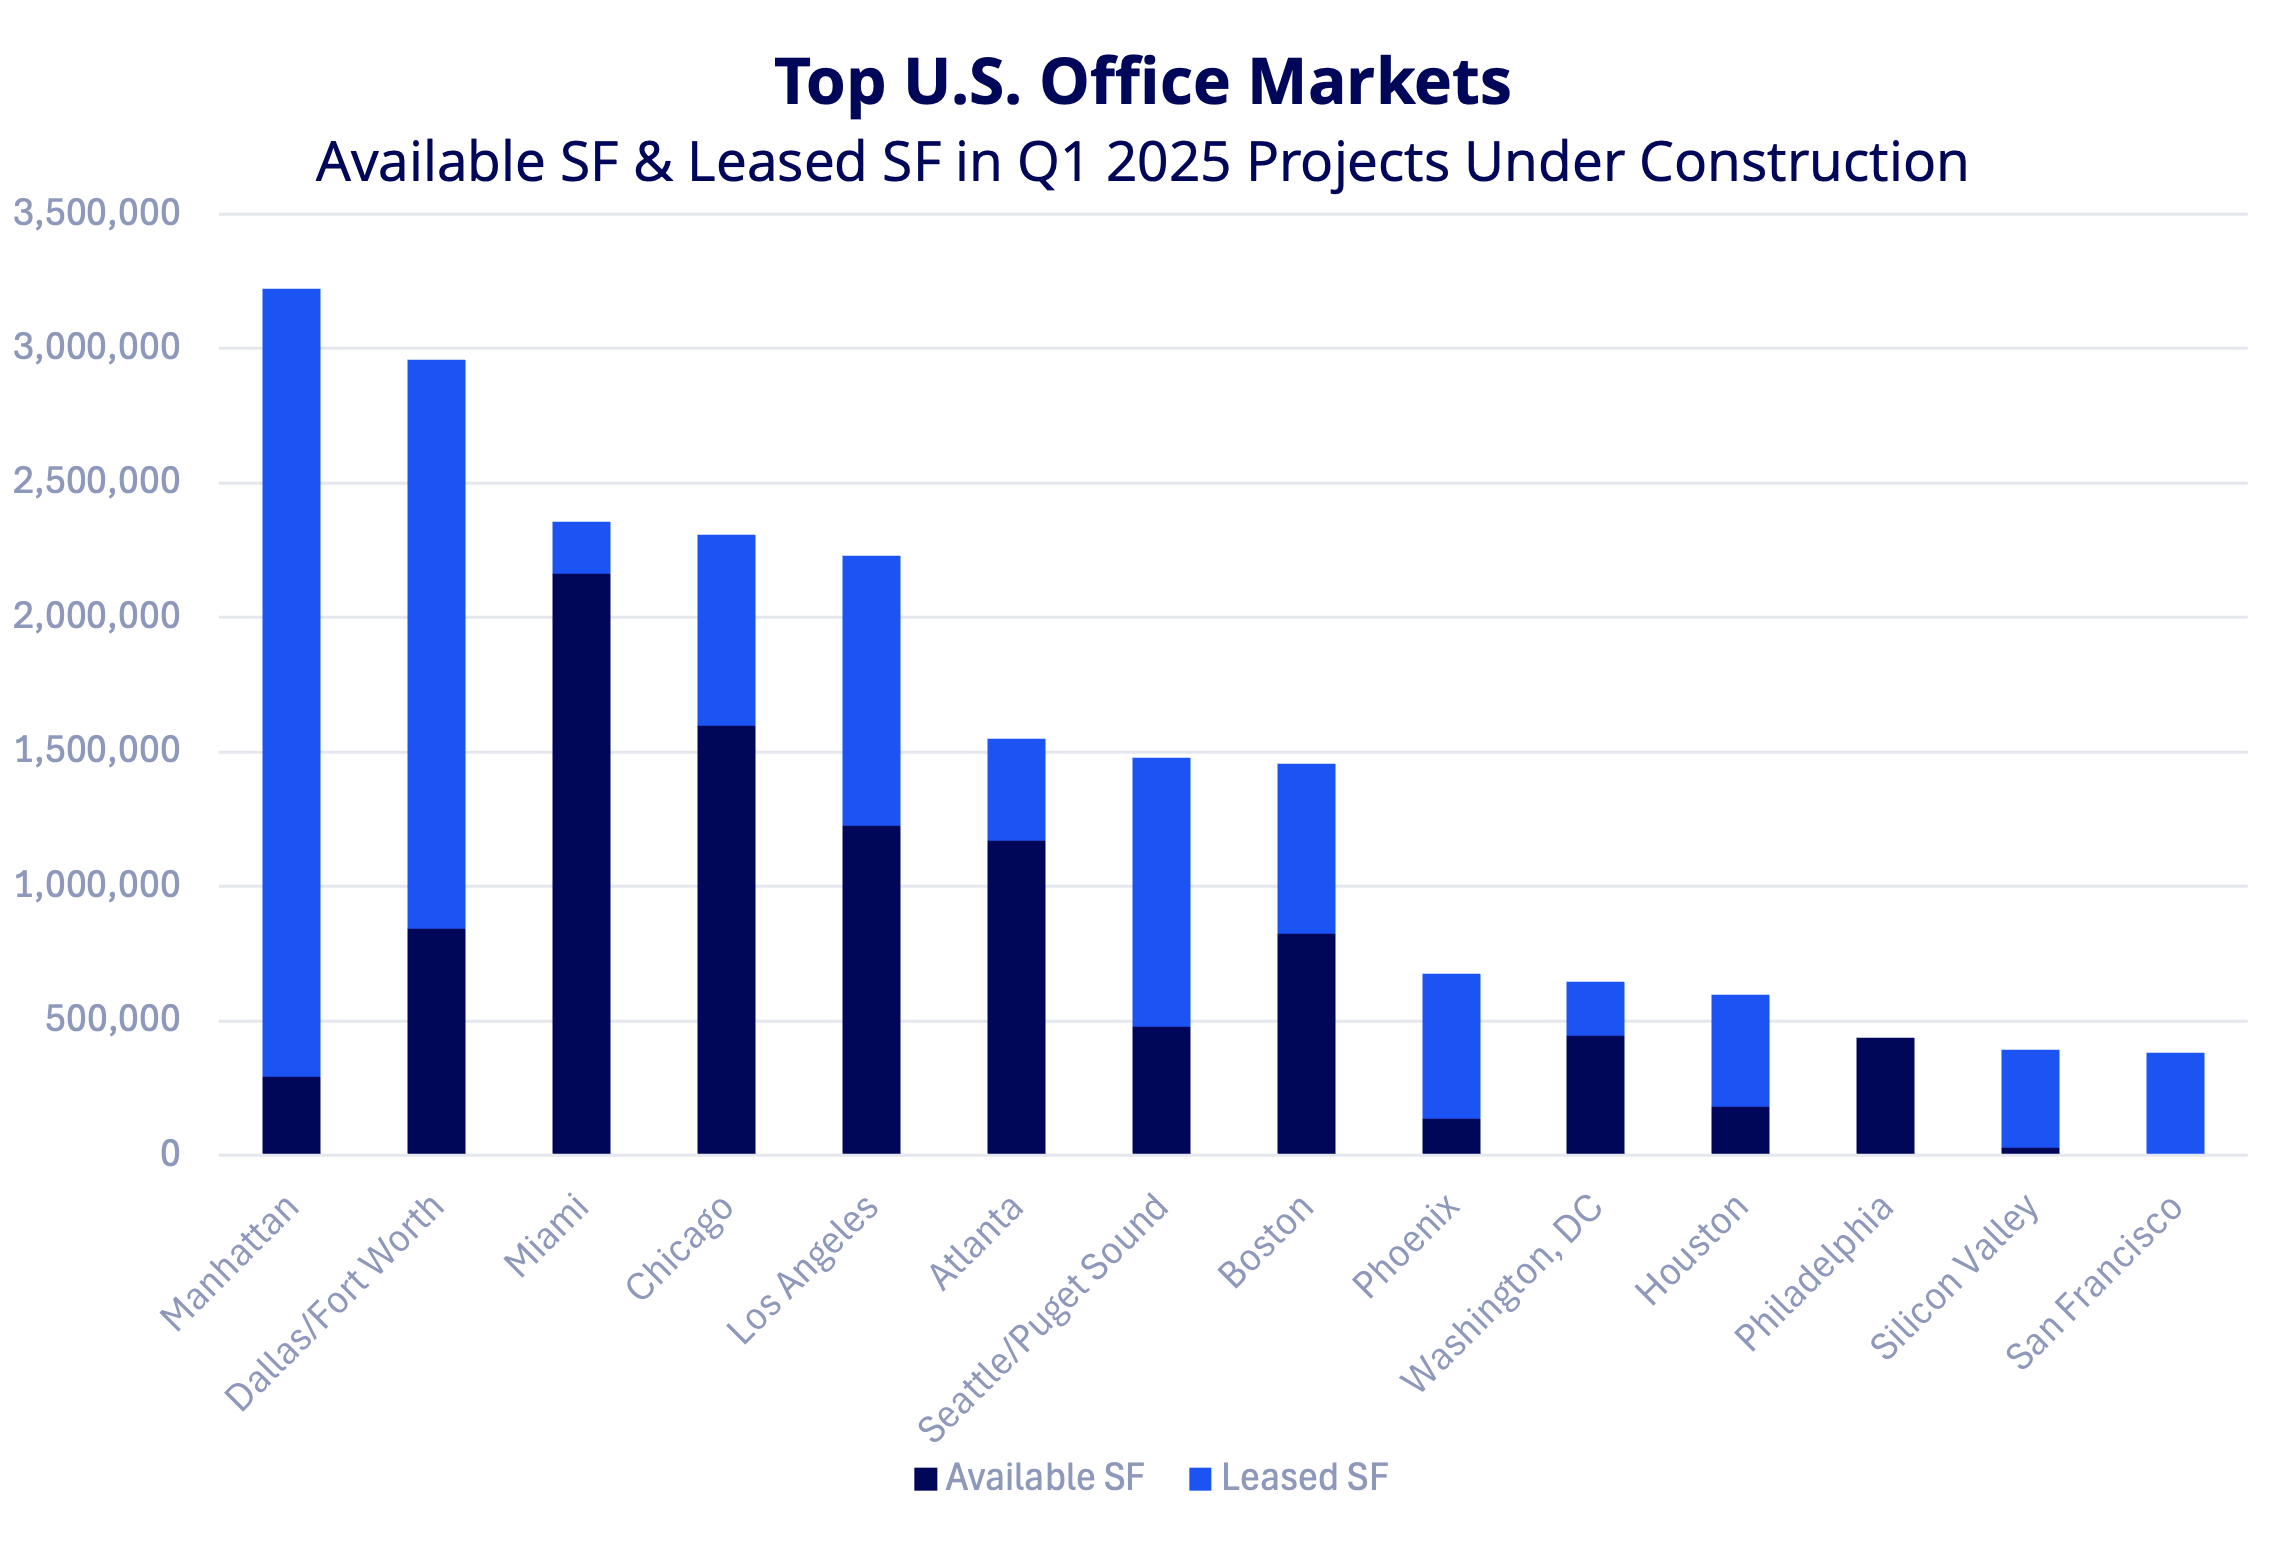
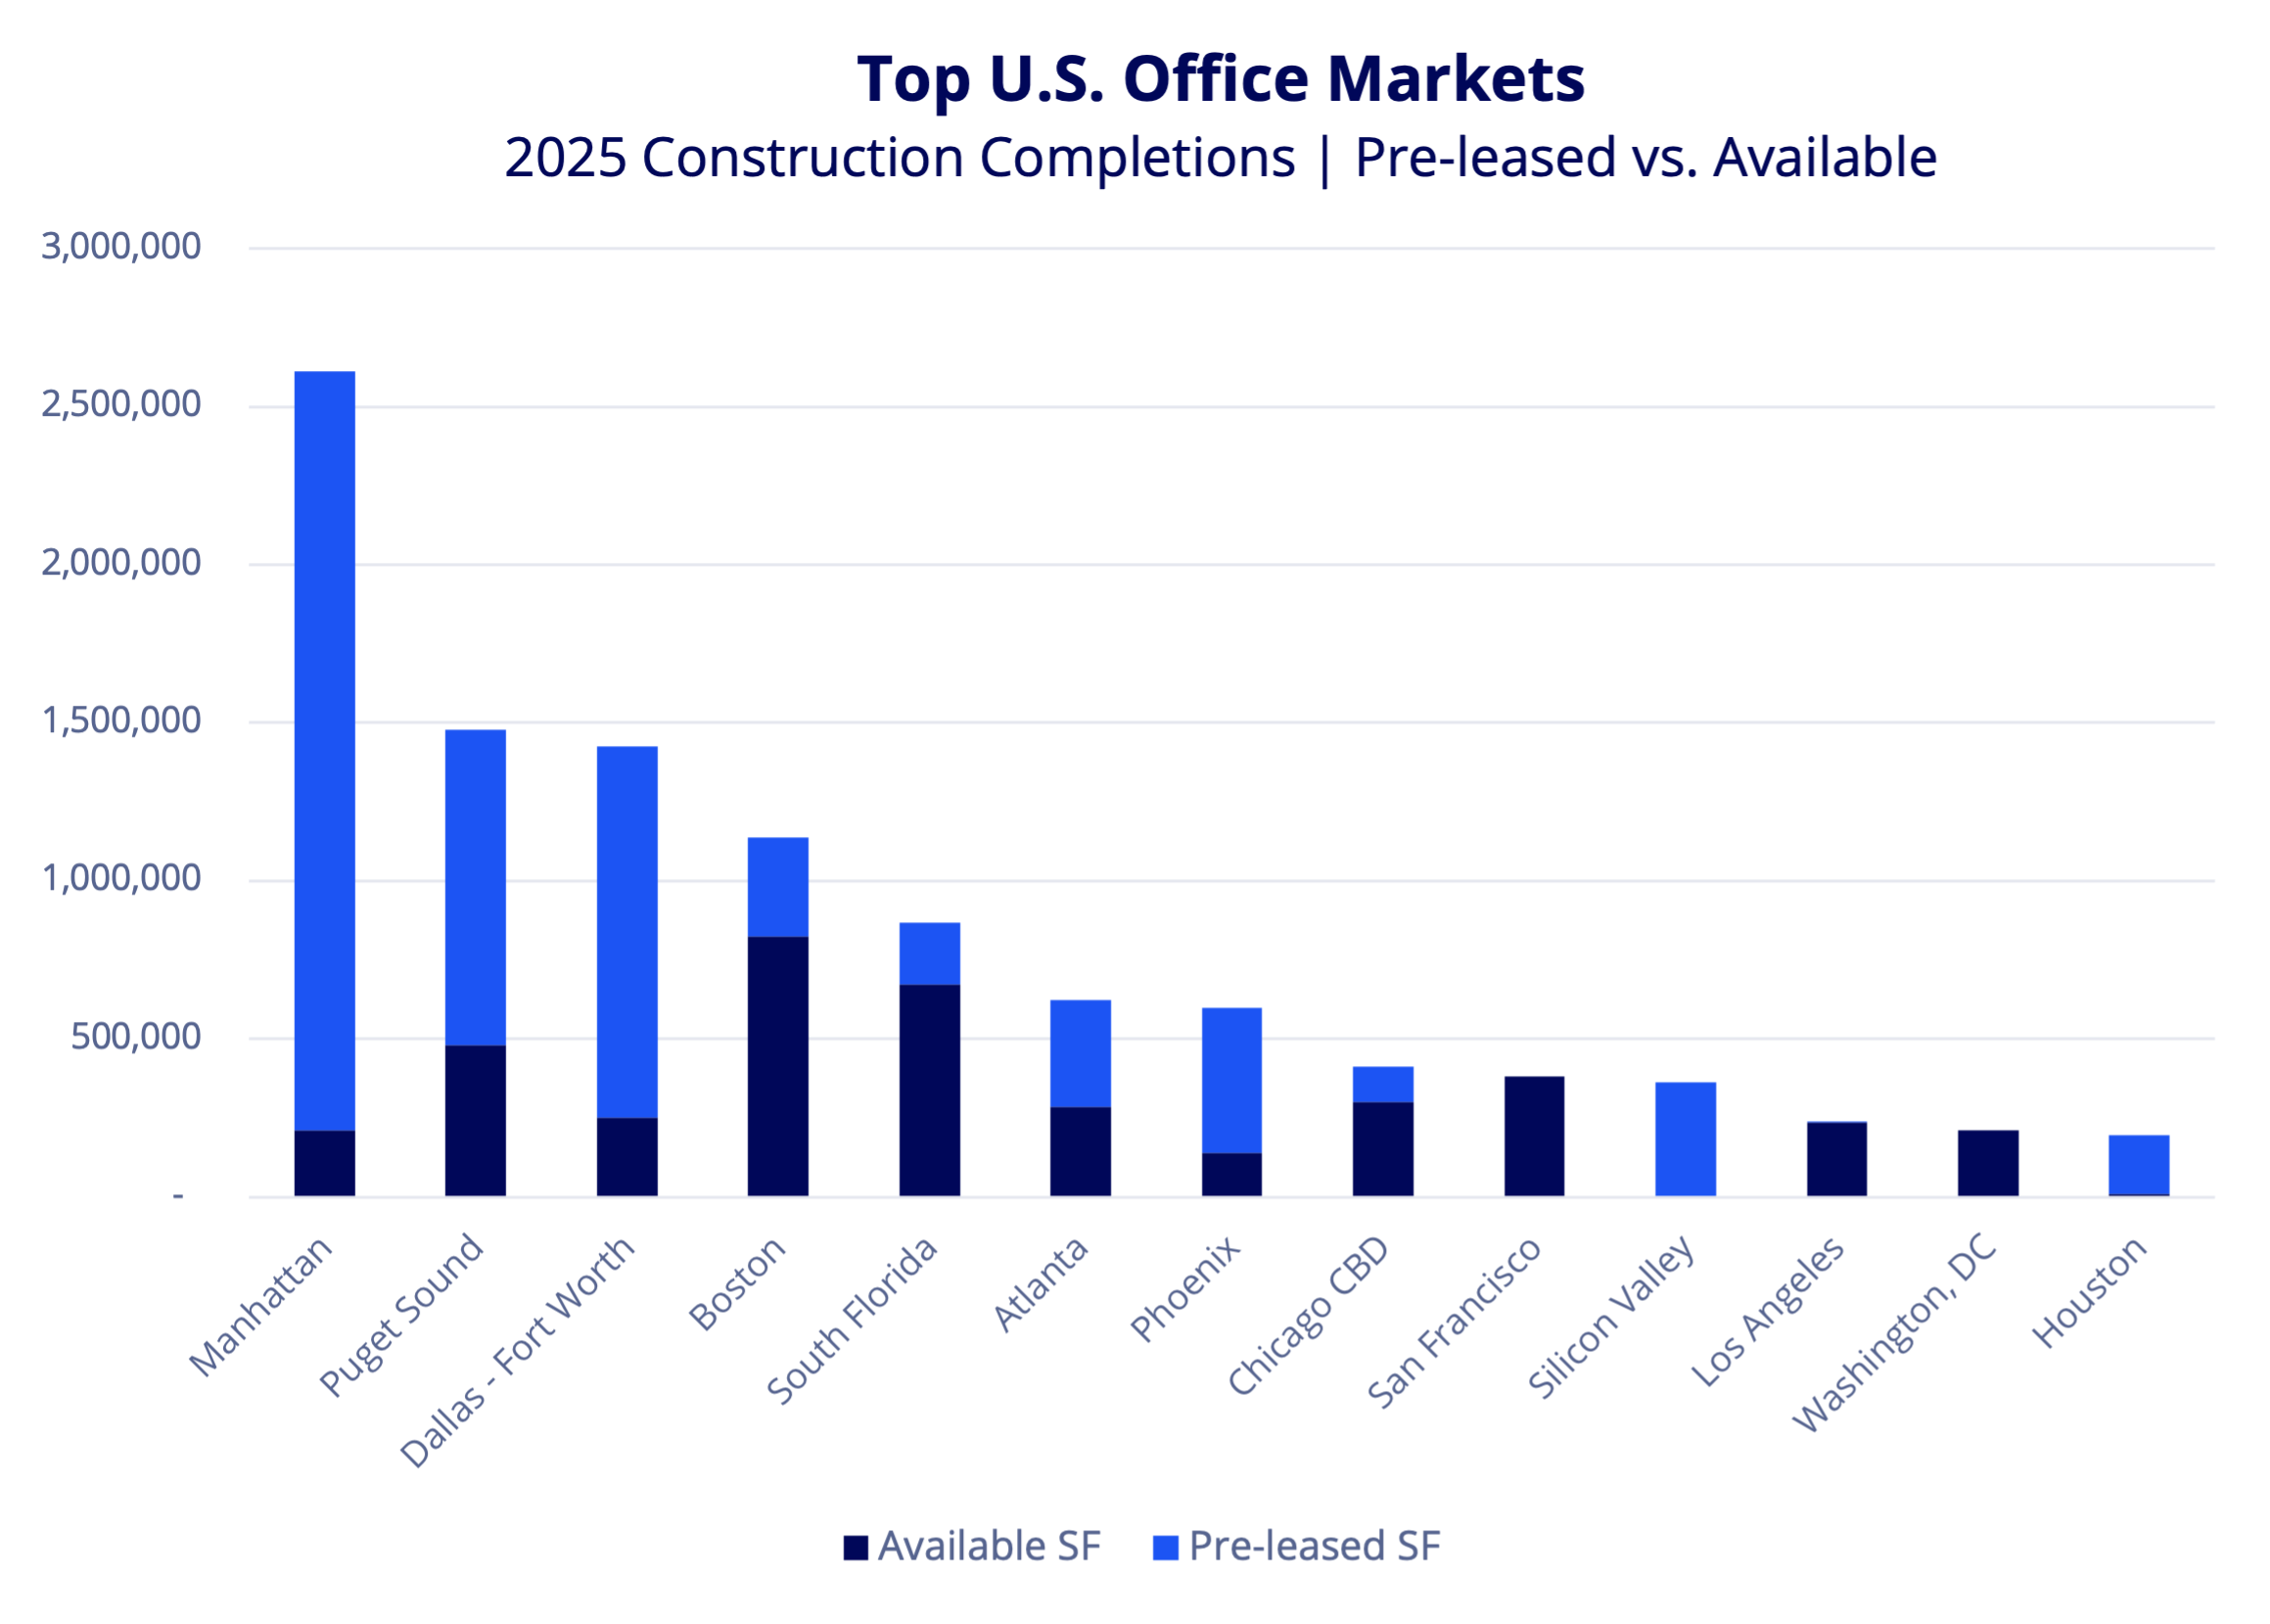
Only 5.6 million square feet of office space delivered across the country in Q1 2025 — the lowest quarterly total in over 15 years. There was just 33.5 million square feet under construction nationwide, down sharply from the peak of nearly 160 million square feet in late 2019. The top 14 U.S. markets account for 62% of what’s underway, and new starts have largely stalled.
With materials, labor, and financing costs near record highs, developers are waiting for strong preleasing before moving forward. About 10.5 million square feet is set to be delivered this year, with 62% of that space already preleased. But looking ahead, the pipeline for 2026 and beyond remains thin. Nearly half of the 2026 deliveries in the top markets were already leased as of Q1 2025.
There are still projects breaking ground, but they tend to be smaller in size and have strong anchor tenants. Recent examples include Bank of America Tower in Dallas, 212 North Peoria in Chicago, Impact at Nash in El Segundo, and Echelon Television Center in Hollywood — all backed by significant preleasing.
As construction continues to decline, some top markets are seeing recovering demand begin to support new development. Manhattan has the strongest demand, overall fundamentals, and lowest Class A vacancy rate, but new supply is still extremely limited. With a 3.27 trailing five-quarter net absorption to under-construction ratio, Manhattan’s current trajectory supports new construction.
Other stabilizing markets with demand nearly matching supply, with absorption-construction ratios close to 1.0, include Dallas/Fort Worth, Philadelphia, and Phoenix. Miami has been a high-growth market in recent years; however, its 0.41 ratio shows supply still outpacing demand in relative terms. Developers in Miami remain bullish, though, with current construction only 8% pre-leased as of Q1 2025. All other top markets had negative absorption-construction ratios, with Chicago, Boston, Seattle, and Los Angeles faring slightly better (oversupplied and weak demand) than the lowest demand markets. The five remaining markets all had -1.0 or lower demand-to-construction ratios.

Layering in vacancies and available new supply adds additional nuance. Manhattan’s Class A vacancy rate was just 10.4% in Q1 2025, while there is only 445,280 square feet of new supply delivered since 2024 available. The quarterly average Class A net absorption in Manhattan in the last five quarters was 2.1 million square feet. Again, Dallas, Philadelphia, and Phoenix appear relatively stable with positive Class A absorption-vacancy figures. Despite a higher Class A vacancy rate in Dallas (24.9%), demand is starting to recover. Miami’s demand is decent with an 18% absorption to vacancy ratio and an even lower vacancy rate of 17.1%. Several markets are still under strain, with high vacancy and poor absorption, including Chicago, Los Angeles, Atlanta, Seattle, Boston, Washington, D.C., the Bay Area, and Houston.
Flight to quality impact on rent
Even in markets with elevated vacancy, trophy space remains in high demand — and is commanding premium rents.
In Chicago, modern towers along the river, like Salesforce Tower and Bank of America Tower, have very little availability despite the city’s broader supply. Class A assets on the river are currently at 15.9% total vacancy, significantly less than the overall Class A vacancy at 18.5% and 23.4% in the overall CBD. Chicago invested in making the Riverwalk an attractive public space, so beyond just enjoying the river views, actually using the Riverwalk adds real value. Tenants continue to seek the best and highest class of office buildings. Chicago trophy asset demand continues to outpace the overall market and Class A in general. At 11.1%, vacancy in trophy assets is 12.3 percentage points below the CBD overall. Rents on high-rise floors of trophy buildings command a premium of $6 to $10 over the average Class A rent.
According to Scott Harper, Senior Vice President, San Francisco continues to have a 45% delta between Premium View and Commodity Space rents. It is common to see a $25 to $30 difference between the top and bottom of a building. In a 30% vacancy market, this trend is expected to continue.

Class A+ space is at a premium, and if demand continues, coupled with conversions, it could ultimately help support the argument for new development or spur major renovations to aging inventory.
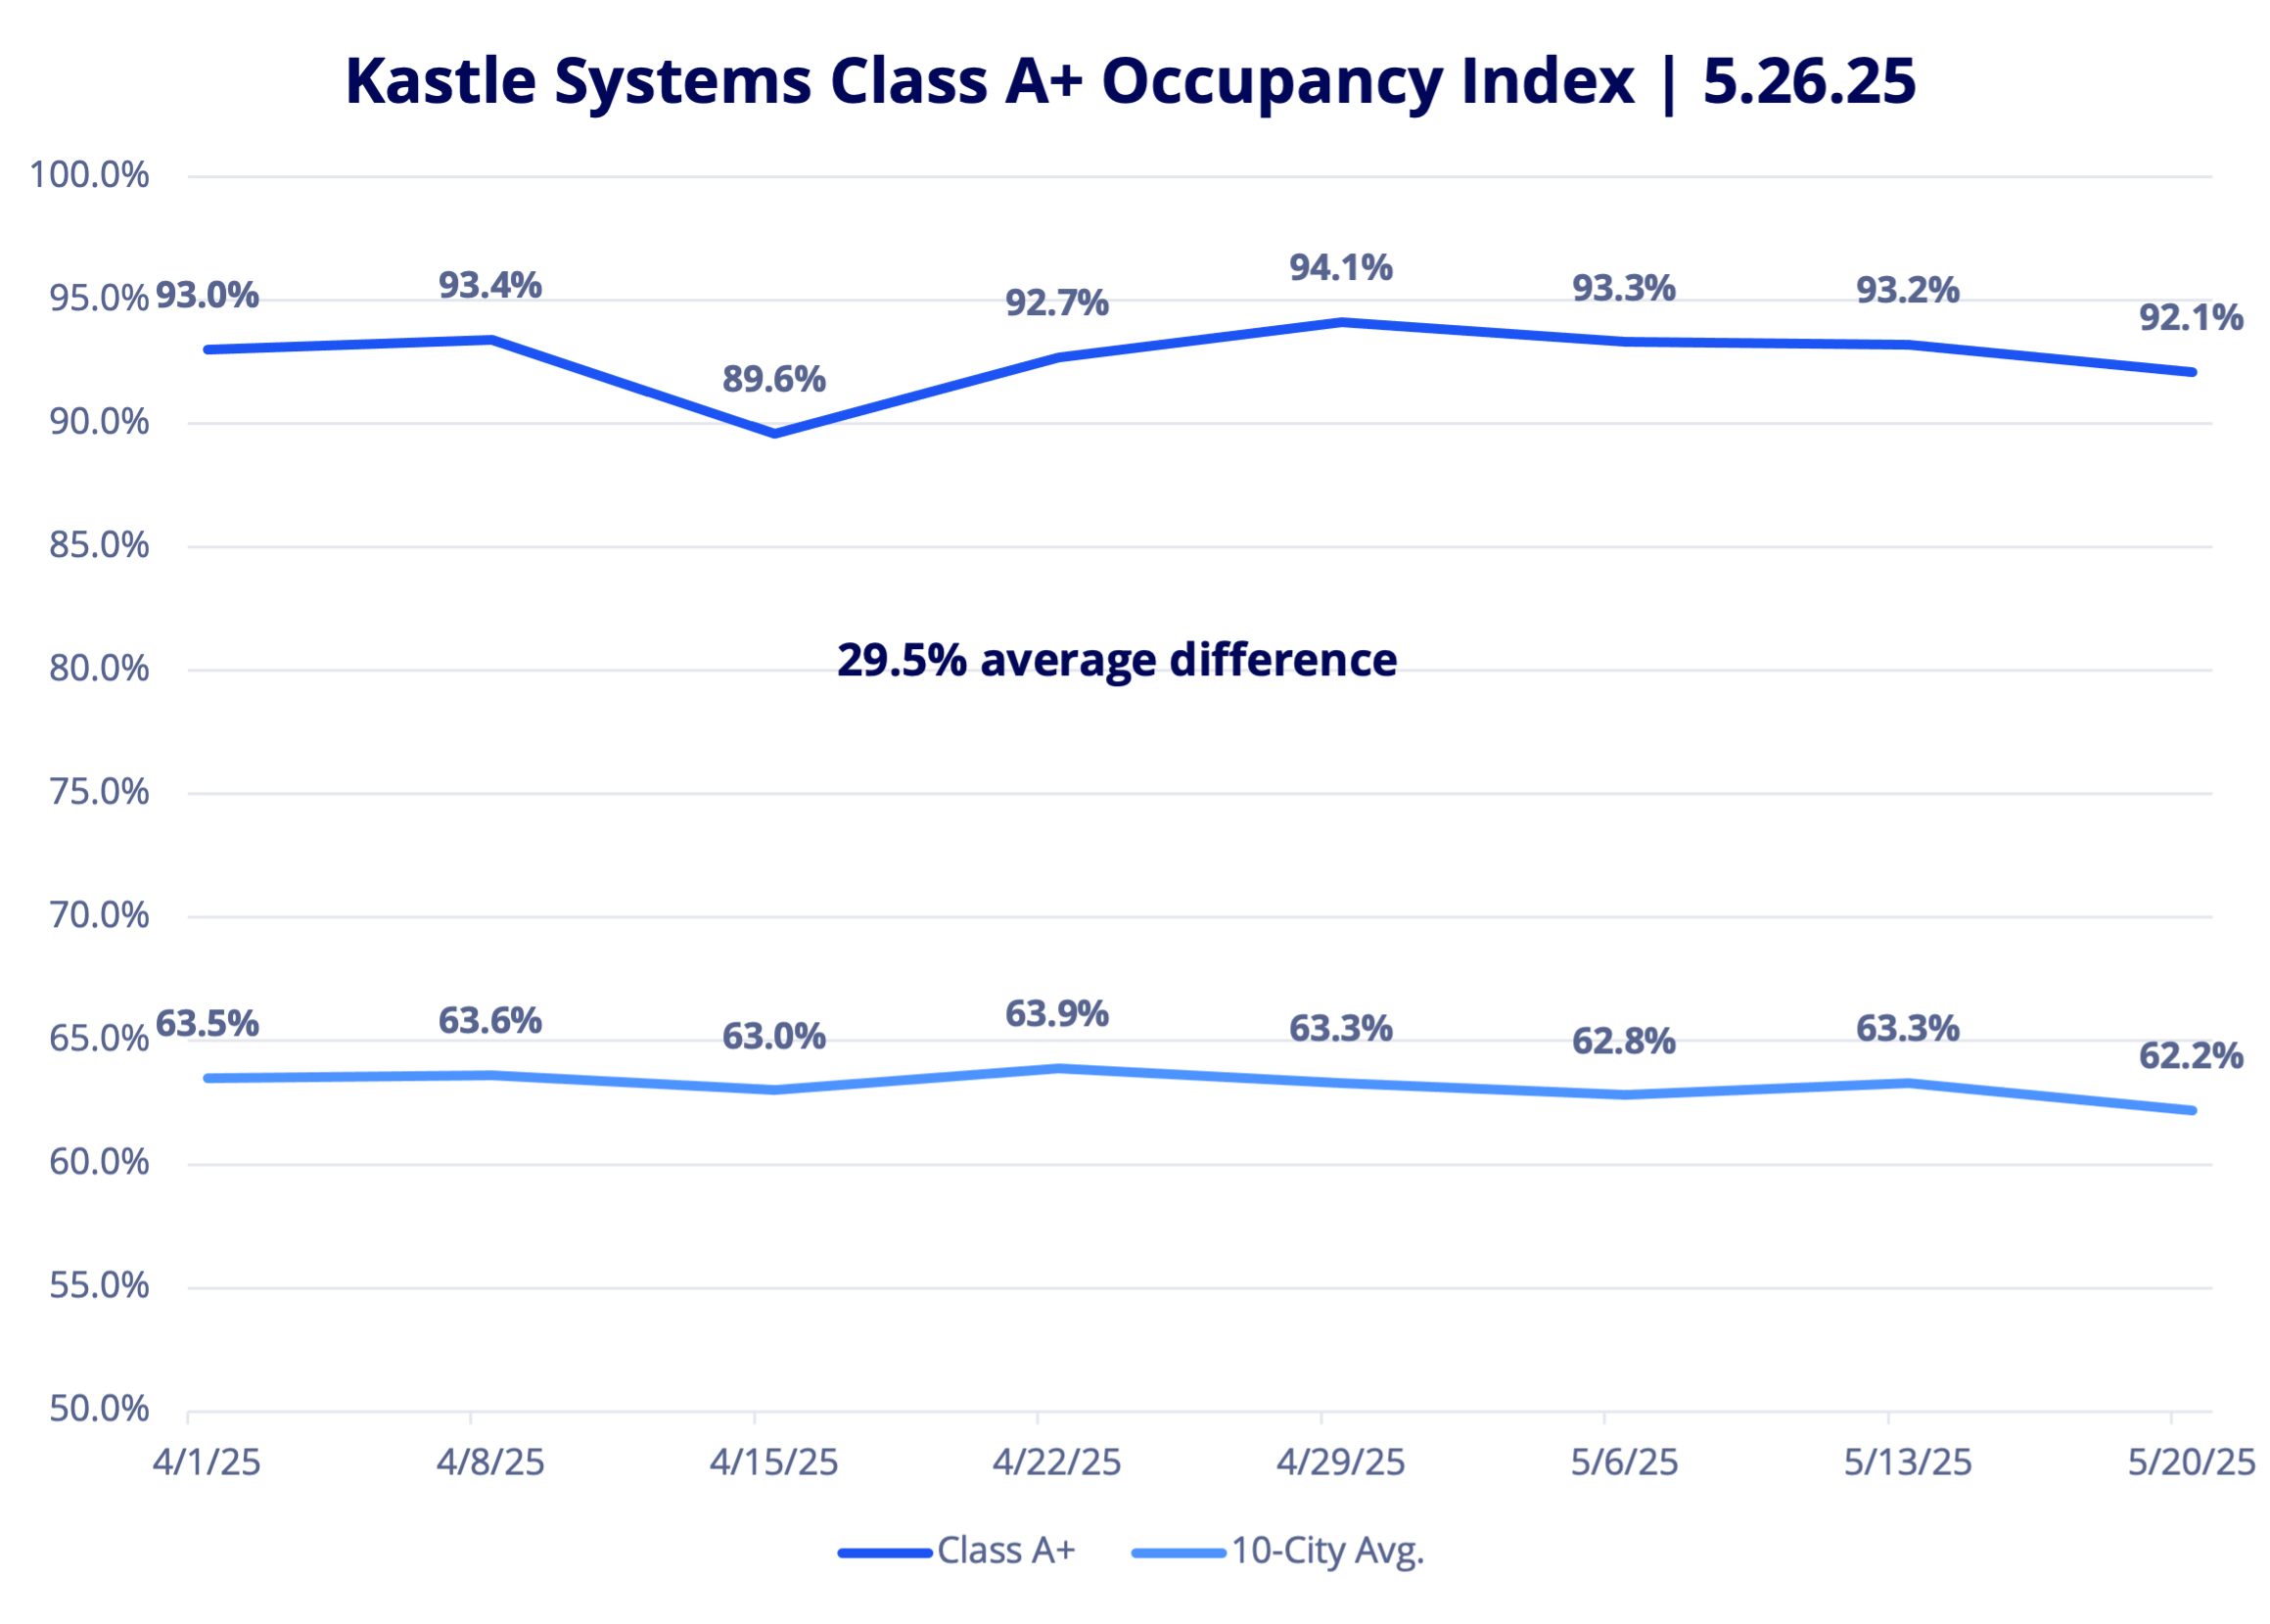
Kastle Systems recently rolled out a new metric for tracking foot traffic, adding a Class A+ dataset, including newer buildings and/or those with modern design characteristics and high-end amenities. The Class A+ sample reflects 2.3% of Kastle’s total tracked set of buildings.
Class A+ buildings in major markets are exceeding 90% of pre-pandemic use on peak days, according to a late May 2025 report from Kastle. That use reaches 94% on Tuesdays, the top day for in-person work. In the eight weeks from April to May before Memorial Day, the average Class A+ occupancy was 92.7%. This compares to the 10-City Average of 63.2%, nearly 30 percentage points lower.
What this means for tenants
New construction has slowed dramatically while cities and developers are evaluating how to transform aging office buildings into something better. The pipeline of new, modern space is thin and will take years to build.
Occupiers have continued to remain cautious due to the overall economic environment, which is understandable given the acceleration of AI and the ongoing uncertainty around trade and tariffs. As a result, some tenants may need to pursue in-place renewals due to the constraints in quality asset supply.
This could impact companies by being limited by options as they continue to promote return to office and focus on recruiting and retaining key talent, or face higher rents and less flexibility in the future.
For occupiers, it is critical to develop a forward-looking strategy, emphasizing deep market insights, to navigate these trends.
Presented by Colliers Tenant Advisory Council.
The Colliers Tenant Advisory Council (TAC) is a specialized group of top advisors dedicated to guiding corporate occupiers through the evolving commercial real estate landscape. Comprised of about 100 members across 50 cities, TAC focuses on best practices, collaboration, and resource sharing to deliver exceptional tenant representation. As businesses face uncertainty, change, and complexity, TAC leverages deep local market insights and strategic expertise to help clients navigate challenges and develop agile real estate strategies that align with their core business goals.
Click the links below to view our previous posts:

 Marianne Skorupski
 Anjee Solanki