 Craig Hurvitz
The 25 largest U.S. industrial markets are entering the next cycle, with clear differences emerging between markets that are tightening, markets that are stabilizing, and markets that are still working through excess supply. Following the most aggressive development boom in industrial real estate history, construction pipelines have largely reset, demand is reaccelerating, and vacancy growth is beginning to slow. The strongest-performing markets today are generally those where supply growth has moderated, occupier demand remains healthy, and developers are selectively re-entering the market. Across much of the Midwest and Sun Belt, fundamentals are improving rapidly, while many coastal markets continue to absorb the record wave of space delivered during the past several years. Together, these trends suggest the industrial market is moving from a period of correction toward the early stages of its next expansion cycle.
Industrial Inventory Growth Since 2020 (% change and total added SF)

Where Has Industrial Growth Been the Strongest?
Since 2020, the 25 largest U.S. industrial markets have expanded their inventories by an average of 15%, adding nearly 1.9 billion SF of new space. Eight of the top 25 markets grew by 20% or more, highlighting where developers were most willing to deploy capital during the recent expansion cycle. Growth was led by Phoenix, which added 137M SF and expanded its inventory by 42%; Indianapolis, which added 90M SF and grew by 34%; and Houston, which added 152M SF and increased by 32%. Inventory growth peaked in 2023 and has since moderated significantly, with the top 25 markets expanding by just 1.3% over the past year.
The industrial construction pipeline likely reached its low point at 268M SF at the end of 2025. While development activity is beginning to recover, inventory growth is expected to remain below pre-pandemic norms through the rest of 2026 before gradually accelerating as construction pipelines rebuild.
New Supply & Net Absorption
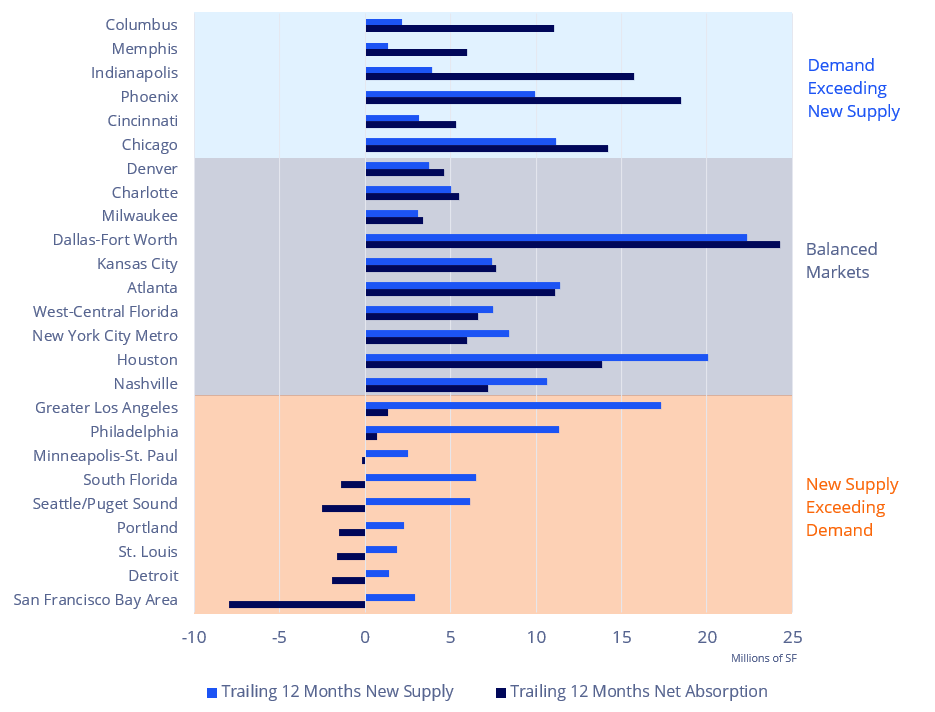
Which Markets Are Tightening the Fastest?
Over the past year, occupier demand and new supply have returned to balance in 16 of the 25 largest industrial markets, helping stabilize fundamentals after several years of rapid development. Six markets have moved into a clear tightening phase, with net absorption significantly exceeding new supply and placing downward pressure on vacancy rates. Columbus led the group, posting 11.1M SF of net absorption against just 2.1M SF of new supply. Indianapolis recorded its strongest year of demand in years, with 15.7M SF of absorption — more than four times its 3.9M SF of new supply. Phoenix absorbed 18.5M SF, nearly double the 10.0M SF delivered, while Memphis, Cincinnati, and Chicago also saw demand materially outpace new construction.
At the other end of the spectrum, several markets continue to work through excess supply. Greater Los Angeles delivered 17.4M SF of new supply over the past year while absorbing just 1.3M SF, while Philadelphia, South Florida, Seattle/Puget Sound, and the San Francisco Bay Area also saw new supply exceed demand. However, the number of markets in this category has continued to shrink as construction activity slows and occupier demand improves, suggesting many industrial markets are approaching an inflection point in the cycle.
Under Construction YOY Percent Change

Where Are Developers Regaining Confidence?
Over the past year, construction pipelines expanded in 12 of the top 25 markets, led by the New York City Metro, where space under construction surged 150% year over year to 10.9M SF. Several Midwestern and Sun Belt markets also saw meaningful increases, including Nashville (+73% to 4.0M SF), Indianapolis (+60% to 4.1M SF), Houston (+34% to 24.0M SF), and Dallas-Fort Worth (+22% to 34.3M SF). Dallas-Fort Worth continues to lead the nation with the largest construction pipeline, accounting for 12% of all industrial space under development in the U.S.
At the same time, 13 of the top 25 markets saw construction decline year over year as developers continued to work through elevated vacancy and slower rent growth. The largest reductions occurred in Philadelphia (-61%), Portland (-48%), Seattle/Puget Sound (-43%), Greater Los Angeles (-43%), and West-Central Florida (-41%). Most coastal markets remain in a period of development retrenchment, while many Midwest and Sun Belt markets are beginning to see selective construction activity return as fundamentals improve.
Under Construction & Demand
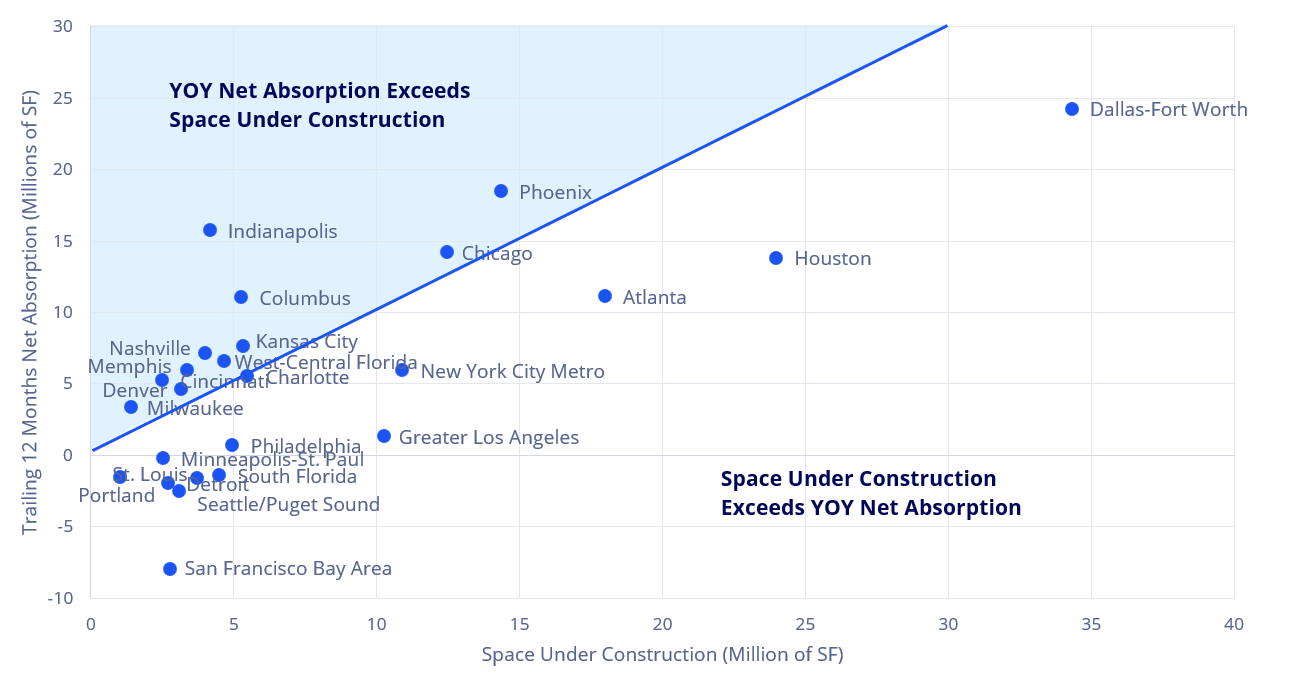
Which Markets Have Room for More Development?
After likely bottoming out at 268M SF at the end of 2025, industrial space under construction increased slightly to 286M SF in Q1 2026, a slight increase year over year, but 60% below the 2022 peak of 711M SF. The top 25 markets accounted for 189M SF, or 66% of the national pipeline.
In 12 of the top 25 markets, net absorption over the past year has exceeded the amount of space under construction, indicating that demand is strong enough to absorb existing pipelines and support additional development. This trend is most evident in several Midwest markets, including Indianapolis, Columbus, Milwaukee, Cincinnati, and Chicago, as well as Phoenix and Nashville. Indianapolis stands out, with 15.7M SF of net absorption compared with just 4.1M SF under construction, while Phoenix has absorbed 18.5M SF over the past year against a pipeline of roughly 14M SF. The remaining 13 markets continue to carry construction pipelines that exceed recent demand, although the degree of imbalance varies considerably. Dallas-Fort Worth, Houston, Atlanta, and Greater Los Angeles maintain some of the nation’s largest development pipelines, reflecting their scale and long-term growth prospects. However, most of these markets have significantly reduced construction activity from peak levels, helping narrow the gap between supply and demand. As pipelines continue to contract and occupier demand improves, an increasing number of major markets are moving toward equilibrium, signaling the early stages of the next industrial development cycle.
YOY Warehouse / Distribution Rent Growth
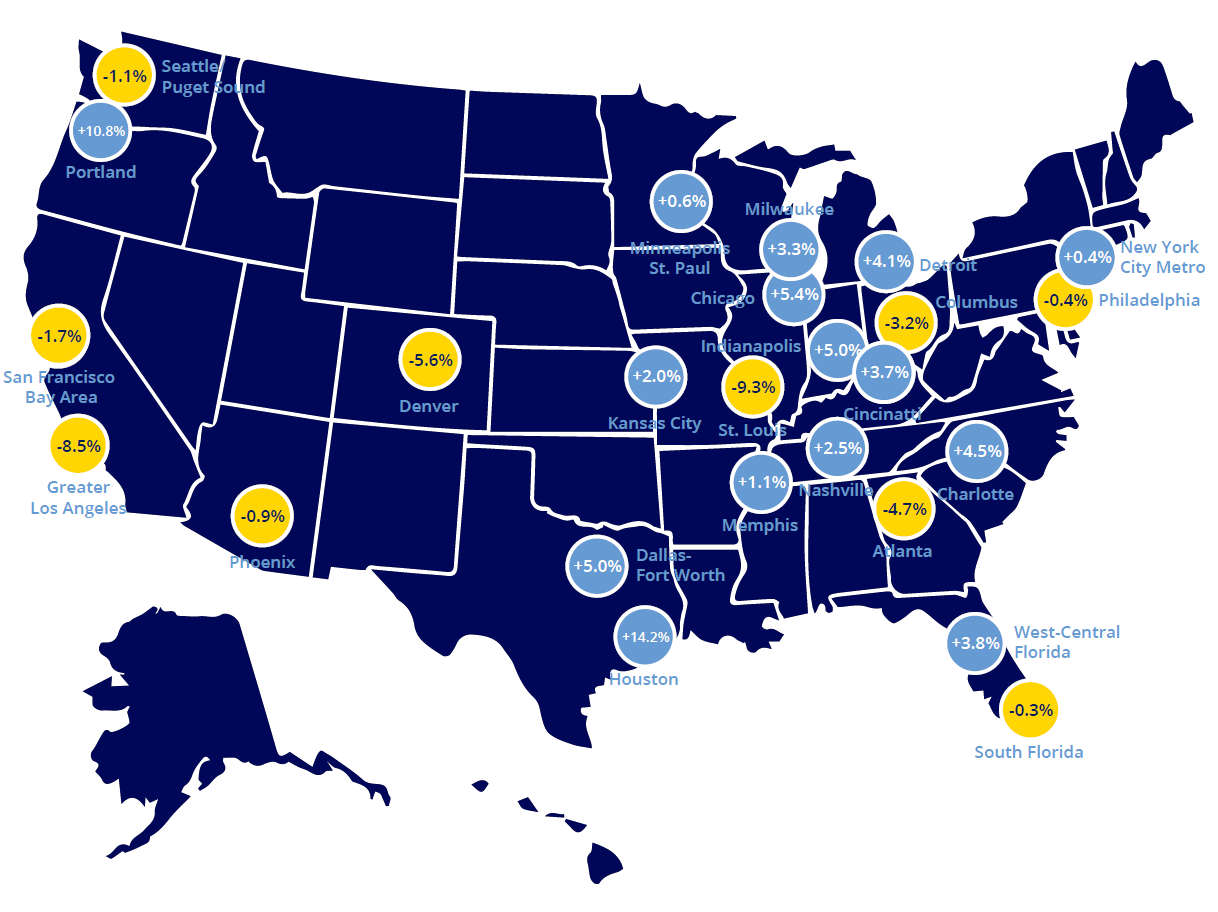
Where Are Rents Still Growing?
Industrial rents are showing increasing signs of stabilization. While average U.S. warehouse/distribution asking rents declined 0.5% over the past year to $10.46/SF NNN, the 25 largest industrial markets posted modest growth of 0.8%, reaching $9.72/SF NNN. Rent gains were concentrated in markets where demand has improved, and construction activity has slowed, particularly across the Midwest and Sun Belt.
Houston led all major markets with 14.2% annual rent growth, followed by Indianapolis (+5.4%), Dallas-Fort Worth (+5.0%), Nashville (+5.0%), Charlotte (+4.5%), and Detroit (+4.1%). In contrast, rent corrections remained largely confined to coastal markets that experienced the strongest pandemic-era increases, led by Greater Los Angeles (-8.5%), Denver (-5.6%), Atlanta (-4.7%), and Columbus (-3.2%). As development pipelines continue to shrink and vacancy rates begin to stabilize, rent growth is becoming more balanced across major industrial markets.
Download the full report here: The Markets That Move America | An Inside Look at the Top 25 U.S. Industrial & Logistics Markets
 Steig Seaward
 Pride Snow
