 Colliers Insights Team
The Chinese are coming! And the Koreans, the Japanese and the Germans! Not to mention the Canadians, by far the biggest foreign investors in U.S. property since 2010. There’s no doubt that foreign capital flows into U.S. commercial property are rising. But is this distorting markets, driving up prices and crowding out domestic investment?
In a word, no.
Investment inflows from beyond our borders continue to rise, but they’re almost in exact proportion to domestic sources. And while several recent high-profile deals perhaps create the perception of wild bidding, the reality is that the high prices that foreign investors pay generally reflect their preference for top markets and more expensive asset types rather than overpaying on any particular deal.
Let’s untangle these issues and review them one at a time. First, capital inflows into real estate are rising across the board amid growing acceptance of real estate as an alternative asset class as well as the anemic returns offered by other investments with comparable risks. Plus, property returns have been on a pretty good run: Annualized returns in the NCREIF index of institutional real estate exceed 12 percent over the past five years.
But the transaction volume last year still was more than 25 percent less than the 2007 record and slightly below the level reached in 2006 — the second highest level ever recorded — and even lower on a real dollar basis. So, the level is high — but not crazy high. And while transaction volumes have been increasing every year since 2009, it’s also true that the rate of increase has been falling every year. Last year was 17 percent greater than in 2013, which was 22 percent greater than in 2012 — which was 27 percent greater than in 2011, and so on.
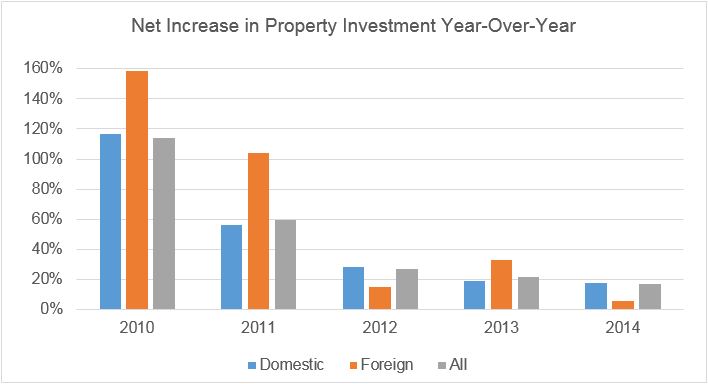
On an absolute basis, the rate of increase has been nearly constant, rising by between $62 and $65 billion in each of the last three years. And mind you, this $400 billion volume registered last year is against a universe of investable real property in the U.S. estimated at over $3 trillion.
Also interesting to note is that the volume split between primary and secondary markets has remained remarkably consistent. The top six markets[1] garner about 40 percent of the apartment market transaction volume since 2009 (ranging from 38 percent to 44 percent), about 60 percent of the office volume (ranging from 55 percent to 64 percent), and a third of the retail volume (ranging from 30 percent to 42 percent). Thus, secondary markets are capturing more capital but only because the pie is growing; their share is about the same as it’s been.
Finally, there’s been a lot of attention paid to a few transactions in which some foreign buyers have supposedly wildly overpaid for trophy assets because they were purportedly more concerned with parking dollars in safe U.S. assets than in achieving a market rate of return. Cap rates of 3 percent or lower have been reported. Only time will tell whether these purchases ultimately earn a competitive return, but a review of the market data does not suggest that foreign buyers are broadly driving prices to unsustainable levels. Rather, the high prices they pay on average reflect their preference for top markets and more expensive asset types.
Foreign capital in U.S. property markets is certainly rising but only in proportion to domestic capital sources. The offshore share has stayed in the range of 9 to 10 percent of all deal volumes (in dollar terms) since 2011. But foreign capital tends to be much more concentrated in high-priced markets and asset types, which perhaps creates the impression that foreign investors pay more for property. Rather, they prefer high-quality assets and pay accordingly. While the top six markets consistently capture about 45 percent of all transaction volume, foreign capital sources allocate an average of 59 percent of their capital to these top markets while the share of domestic investment is only about 43 percent. Alternately stated, the foreign share of deals is almost 14 percent in the primary markets but less than 6 percent in secondary and tertiary markets.
| Foreign Share of US Commercial Property Transactions | |||
| All Property | Major Markets | Secondary | |
| 2010 | 8.2 percent | 10.0 percent | 6.5 percent |
| 2011 | 10.4 percent | 13.6 percent | 7.4 percent |
| 2012 | 9.4 percent | 12.1 percent | 7.0 percent |
| 2013 | 10.4 percent | 13.9 percent | 7.5 percent |
| 2014 | 9.4 percent | 13.7 percent | 5.9 percent |
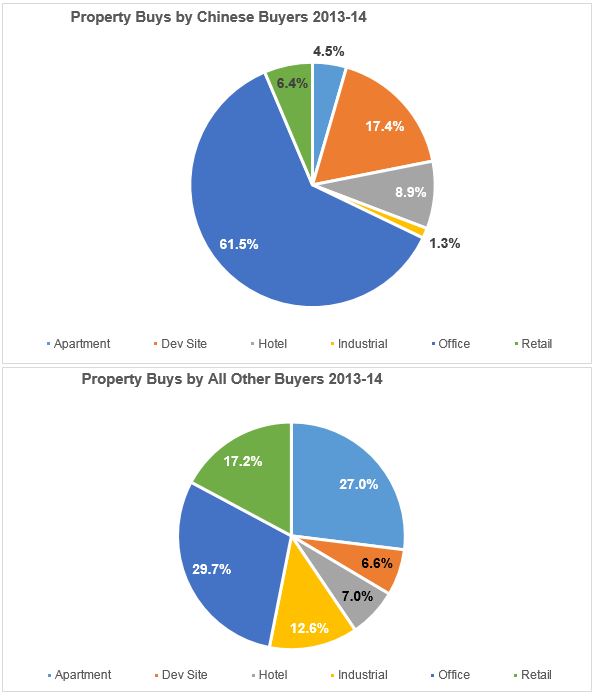
Similarly, foreign capital sources tend to buy more hotels and especially offices, which are more expensive per square foot on average, while they tend to avoid less expensive assets like apartments and industrial. Again, this tends to drive up the average price per asset but not does not necessarily imply they are overpaying on any particular deal. For example, this graphic profiles purchases by Chinese vs. all other buyers of U.S. commercial real estate over the past two years:
As to whether property markets overall are overheating, or especially in the top six markets, as more capital floods the market, we’ll leave that issue for a future blog post. But regardless, it wouldn’t be foreign buyers alone who are providing the fuel.
[1] For apartments, office and retail, the top six metros are New York, Washington, D.C., Boston, Los Angeles, Chicago, and San Francisco. For industrial, the primary markets are Los Angeles, Dallas, Chicago, Northern New Jersey, San Jose and Riverside.


 Anjee Solanki