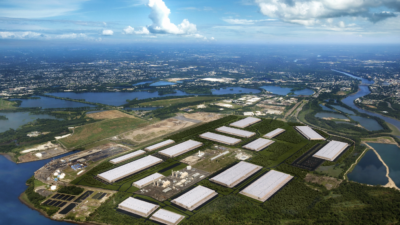
“New entrants to the Salt Lake County industrial market include Amazon’s approximately 2.2 million-square-foot multi-level/multi-building lease, UPS’ 875,000-square-foot regional processing facility, which is one of UPS’ largest processing facilities across the globe, and Stadler Rail’s only U.S.-based manufacturing facility and test track. These entrants to our market give new credence to our state song “Utah, this is the Place,” and will unquestionably lead the way to a bigger and brighter Utah.
Salt Lake County’s recent influx of large industrial users, airport expansion, proactive government and continued positive press will keep Utah in record setting territory throughout 2018. Developers will continue to acquire land and construction starts and deliveries will continue to be above average. Tenant activity will remain high, keeping vacancy low and lease rates will continue to increase. The owner-user market will continue to experience heavy demand with a lack of available product, which will keep prices high. Cap rate compression will continue in Class A institutional-grade product, drawing sellers out and leading to additional sales.” — Rusty Bollow, Senior Vice President, Salt Lake City, UT
Key Strengths:
The Salt Lake County industrial market continues to see growth. Since 2012, developers and owner-users have added more than 15 million square feet to our industrial base, lease rates have increased in almost all product types, speculative development continues to flourish and direct vacancy continues to drop. Utah will remain one of the fastest growing states in the nation, and it is expected to grow by an additional 8% in the next five years. Its continued additions and improvements to existing road infrastructure as well as the potential availability of 3,500 acres of newly developable industrial land within a 15-minute drive of downtown Salt Lake City, have all contributed to keeping Utah in the nation’s spotlight. As of December 2017, the Economic Development Corporation of Utah has had 56 open industrial projects.

Nearly four million people live within 250 miles of the market’s core. The region also has a strong millennial population, as 23.4% of the people living within 50 miles of Salt Lake City’s core are within this age bracket. The population is projected to grow by 8% in the region in the next five years. This growth, along with Salt Lake’s central location, is making it a popular destination for regional and final-mile distributors. Demand to get products into and out of the region is increasing and has led to a major expansion of the Salt Lake International Airport. The airport, which is ranked 24th in the country in air cargo, recently completed a $3 billion expansion to better serve passengers and cargo companies.
Vacancy:
The Salt Lake County industrial market, which totals 135 million square feet of existing space, saw vacancy rates drop the first half of 2018 to an all-time low of 3.2%. Vacancy rates are lowest in product under 20,000 square feet, with less than 2% of the existing stock currently vacant. Vacancy rates increased slightly in product over 100,000 square feet to 4.2% at midyear. Despite this rise, vacancy rates are very low compared with tenants in the market and more development is warranted to quench this demand.
Absorption:
The market is one of the fastest growing markets in the country, and continues to post positive absorption despite the record low vacancy rates. Over 1.1 million square feet of occupancy gains occurred the first half of 2018. With new leasing projected to be strong along with large build-to-suit occupancies in the second half of 2018, the market will finish with its seventh consecutive year of positive absorption.
Development:
Developers and owner-users continue to break ground on new industrial buildings despite continually increasing land and construction costs. In fact, 2017 was the largest year on record for new construction deliveries with 3,970,641 square feet reaching completion. 2018 is looking to be very similar to last year, with a current 2,253,098 square feet of construction completed and a decade high 4,437,045 square feet currently under construction.
Recently delivered properties include Post Foods 903,000-square-foot distribution building, Seefried’s 500,000-square-foot speculative distribution building and Price’s 300,000-square-foot build-to-suit for Keystone Automotive Industries. Notable building deliveries planned for 2018 include Amazon’s 857,173-square-foot build-to-suit, UPS’ 870,000-square-foot build-to-suit, Hamilton Partners’ two-building speculative project totaling 472,362 square feet and RWK’s speculative 214,391 square feet building.
Asking Rents:
The Salt Lake County industrial leasing market remains strong. This fact coupled with declining vacancy rates has provided landlords with the long-awaited opportunity to increase rents. The overall average rental rate for 2018 was $5.40 per square foot triple net (NNN), which is a $0.48 increase over this time last year. General purpose buildings saw the greatest rental rate increase in 2018 with rents increasing by $1.20 per square foot, followed by incubator and bulk distribution buildings, which posted gains of $0.72 and $0.48 per square foot.
Lease rates will strengthen over the remainder of 2018 as higher land and construction costs force landlords to increase rents. Asking lease rates for first-generation space have increased by as much as 30%, with medium distribution and incubator buildings being the most heavily affected by these increases. Salt Lake City continues to gain interest from out-of-state investors and was recently named in a report produced annually by PricewaterhouseCoopers LLP in collaboration with the Urban Land Institute as the #3 most desirable U.S. market for real estate investment and development. It’s important to note that Salt Lake is the smallest real estate market to ever crack the top 10 on this list. Salt Lake City is positioned, now more than ever, to take advantage of what should continue to be a very robust investment market.
Historical Data |
||||||
|---|---|---|---|---|---|---|
| Inventory | Overall Vacancy Rate | Overall Net Absorption | New Supply (Construction) | Under Construction | Asking Rental Rate (PSF/YR) | 2009 | 199,561,585 | 12.4% | -5,338,274 | 1,483,190 | 160,225 | $4.57 | 2010 | 199,721,810 | 13.1% | -1,706,698 | 160,225 | 264,722 | $4.36 | 2011 | 200,013,752 | 11.6% | 3,782,351 | 291,942 | 1,325,353 | $4.19 | 2012 | 201,889,742 | 10.7% | 3,491,793 | 1,875,990 | 136,842 | $4.39 | 2013 | 202,274,490 | 8.0% | 5,697,676 | 384,748 | 1,805,965 | $4.68 | 2014 | 127,348,508 | 7.0% | 772,672 | 825,365 | 2,500,000 | $5.28 | 2015 | 129,933,008 | 6.3% | 1,947,131 | 2,584,500 | 1,247,991 | $5.40 | 2016 | 131,746,801 | 5.1% | 1,967,069 | 1,813,793 | 2,041,991 | $5.64 | 2017 | 133,479,434 | 4.0% | 3,970,641 | 1,772,683 | 4,354,883 | $5.88 | 1H 2018 | 135,242,022 | 3.2% | 1,146,487 | 2,253,098 | 4,437,045 | $5.40 |
| Overall Vacancy Rate Q2 2017 | Overall Vacancy Rate Q2 2018 | Asking Rental Rate Q2 2017 (Yearly) | Asking Rental Rate Q2 2018 (Yearly) | 0-4,999 SF | 4.3% | 0.8% | $6.96 | - | 5,000-19,999 SF | 3.9% | 1.4% | $6.24 | $6.17 | 20,000-49,999 SF | 4.1% | 3.0% | $5.64 | $7.86 | 50,000-99,999 SF | 4.9% | 1.8% | $4.80 | $4.78 | 100,000+ SF | 3.7% | 4.2% | $4.56 | $4.22 |
|---|
For more insights, learn about the top 10 U.S. industrial emerging markets positioned to experience the most robust increases in demand from occupiers and owners. Read all the past market spotlights here and stay tuned for more Industrial Markets of the Month!

 Colliers Insights Team
 Patrick Beard
 Jacob Crist
 Michael Golarz
 Tom Golarz
 Craig Hurvitz