 Franklin Wallach

As the Downtown Manhattan — also known as Lower Manhattan — neighborhood comes into focus ahead of the 25th anniversary of September 11, the current state of the Lower Manhattan office market offers a window into the area’s continued evolution and resilience over the past quarter century. With nearly 100.0M SF of office inventory, the area is New York City’s oldest office market and has undergone a tremendous transformation over the years. A constant across each of those transformations has been the market’s capacity for recovery. The market demonstrated that resilience following 9/11, the Great Recession, Superstorm Sandy and, most recently, following the COVID-19 pandemic in 2020. As we assess the Lower Manhattan office market today, the data indicates that a post-pandemic recovery is underway, although its progress varies considerably by metric, building segment, and submarket and is occurring at a different pace than the recovery that followed 9/11.
Tenant Migrations: A Changing Competitive Position
In Manhattan’s increasingly borderless market, in which office tenants have shown more willingness to relocate between Midtown, Midtown South and Downtown, Lower Manhattan was able to successfully capitalize on this trend. After Midtown’s emergence as the dominant Manhattan market in the post-World War II era, Lower Manhattan lost numerous major financial, legal and professional services tenants to its neighbor to the north. This continued in the aftermath of 9/11 as office tenants were forced to relocate from Downtown due to damaged or destroyed buildings, including Cantor Fitzgerald, Lehman Brothers, and Sidley Austin.
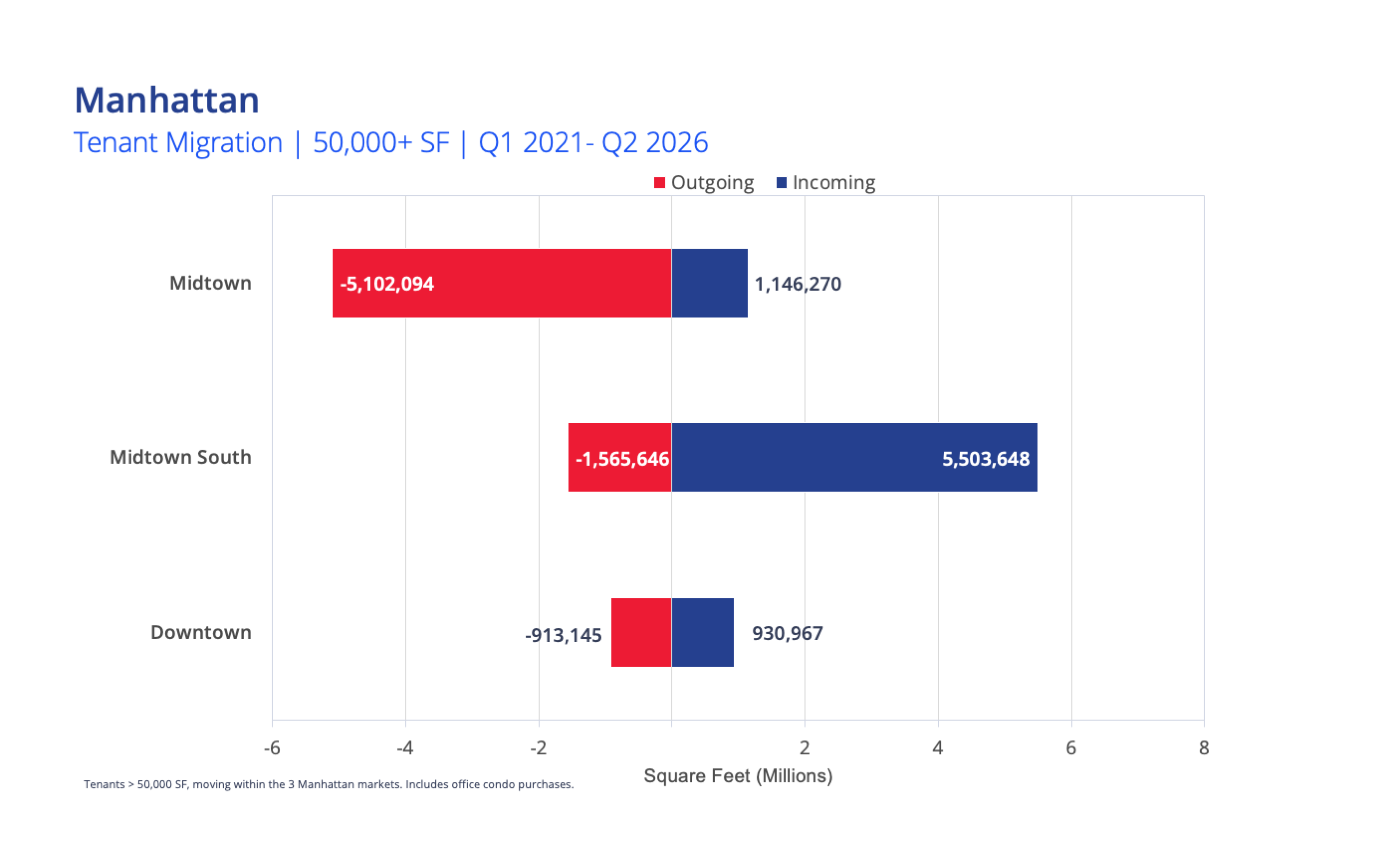
But by 2011, Lower Manhattan’s post-9/11 recovery had reached a critical milestone in its attempt to reverse the outward migration of tenants when Condé Nast leased more than 1.00M SF at 1WTC (World Trade Center) and WilmerHale leased 211,000 sq. ft. at 7WTC (both tenants relocated from Midtown). From 2011 through Q2 2026, large-tenant relocations (50,000+ sq. ft.) from Midtown and Midtown South brought 12.12M SF of occupancy to Downtown. The tenants who moved included notable firms such as Spotify, Jones Day, Justworks, Uber, McKinsey & Company, Droga5, and The Associated Press.
However, nearly all of the relocations to Lower Manhattan occurred between 2011 and 2020 with 78 separate moves totaling 11.19M SF. Since 2021, only 0.93M SF of relocations from 11 separate large tenants occupying at least 50,000 sq. ft. took place, led by Freshfields Bruckhaus Deringer’s 180,000-sq.-ft. relocation to 3WTC in 2022. In recent years, Lower Manhattan has faced renewed competition from a revitalized Midtown market and the newly developed Hudson Yards/Manhattan West submarket within Midtown South. Recent outflows from Lower Manhattan to Midtown and Midtown South since 2021 have totaled 0.91M SF and included tenants such as Scotiabank, Rippling, and WTW.
Availability Has Decreased from its Peak
Downtown is certainly no stranger to dramatic increases in office supply, whether stemming from the dot-com bubble bursting, 9/11, the Great Recession or more recently, the pandemic. In March 2020, Lower Manhattan’s availability rate was a healthy 10.3% and approximately in line with the market’s long-term equilibrium rate of 10.0%.1 But the pandemic led to a rapid increase in Downtown’s available office space, which more than doubled from 10.94M SF in March 2020 to 23.05M SF by February 2024 with an availability rate of 21.7%, surpassing the post-9/11 peak of 17.3% in Q4 2004 and the post-Great Recession peak of 17.0% in Q2 2013.
After February 2024, however, the available supply subsequently declined. As residential conversions, increased tenant demand and return-to-office trends contributed to the recovery, the available supply was cut by more than one-third to 15.17M SF with an availability rate of 15.2% as of August 2026, though still substantially higher than the 10.3% rate in Q1 2020. By comparison, six years after 9/11, Downtown’s availability rate had fallen to 8.0% in Q3 2007 and was well below the 10.2% level in Q3 2001.
Of course, office availability varies considerably across Downtown’s buildings and submarkets, and some pockets of Lower Manhattan have returned to, or approached, pre-pandemic availability levels. For instance, among Downtown office buildings delivered since 2000, the availability rate was 8.9% in Q2 2026, well below the segment’s 11.3% rate in March 2020. And at 11.9%, the WTC submarket ended the second quarter of 2026 almost in line with its rate in March 2020 (11.0%). Yet, just east of the WTC submarket, the Financial District’s Q2 2026 rate of 21.8% — the highest in Manhattan — was more than double the Q1 2020 level of 10.1%.
Downtown in Demand
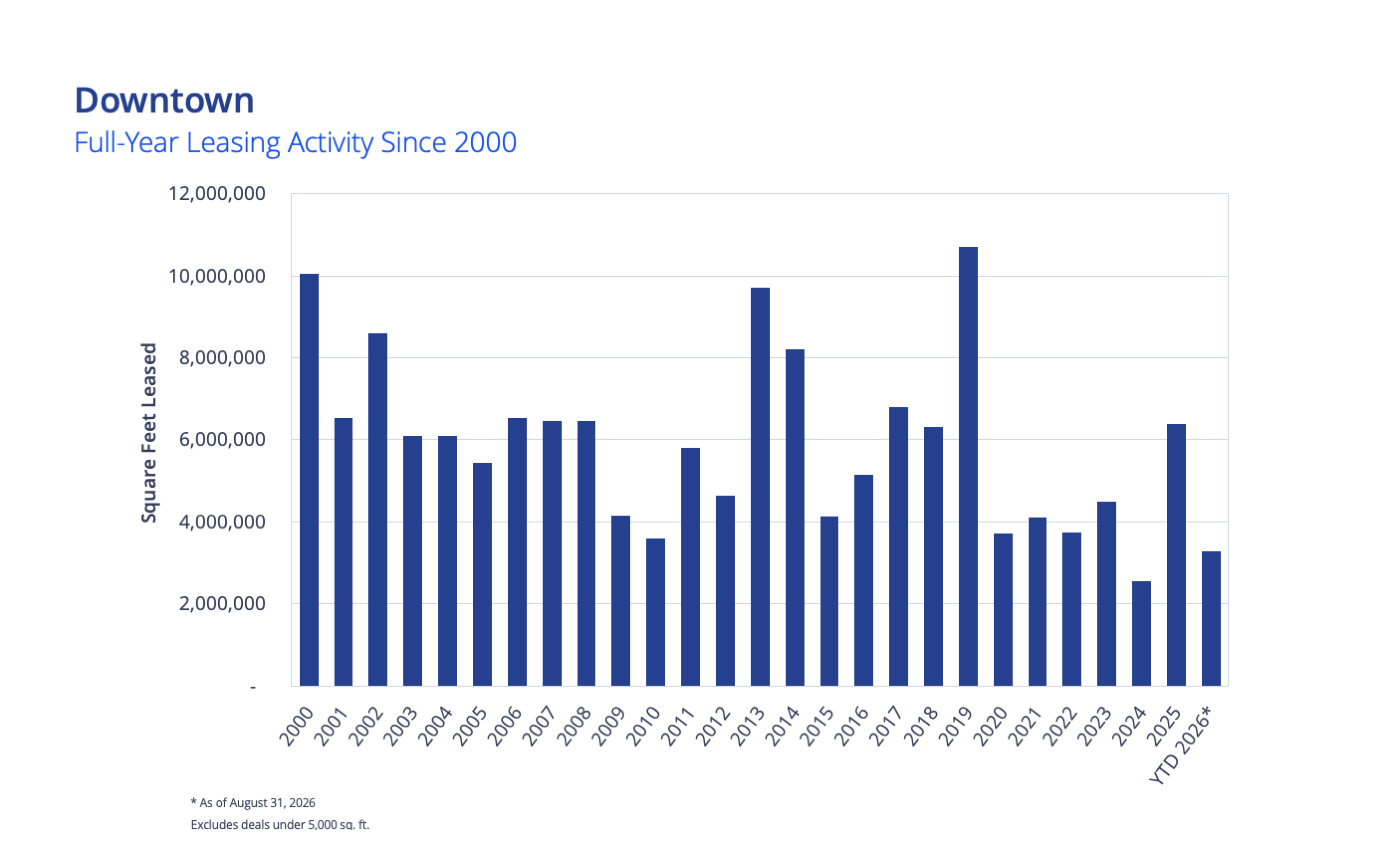
In 2019, Lower Manhattan recorded its highest annual leasing volume on record (10.70M SF), exceeding the previous record of 10.04M SF in 2000, and led by major leases from Morgan Stanley (1.32M SF), New York City Health and Hospitals Corporation (527,000 sq. ft.), the State of New York (523,000 sq. ft), American International Group (462,000 sq. ft.) and EmblemHealth (439,000 sq. ft.).2 In 2020, however, leasing volume fell sharply as a result of the pandemic. Downtown’s demand dropped by more than 65.0% to 3.71M SF, and annual leasing volume did not surpass 5.00M SF until 2025 (6.39M SF). By comparison, although Lower Manhattan’s annual leasing volume declined from its 2000 record following 9/11 — by more than 40.0% to 6.53M SF in 2001 — the drop was not nearly as sharp and subsequently improved to 8.60M SF in 2002.
While Downtown leasing activity improved by 2025, the annual volume remained well below the 2019 total. By contrast, the overall Manhattan market’s yearly demand in 2025 (41.92M SF) was on par with the 42.97M SF leased in 2019. Furthermore, as of August 2026, the Manhattan office market’s year-to-date leasing total of 29.91M SF puts it on pace for the strongest year of leasing velocity since 2000 if current trends continue. Lower Manhattan has not experienced the same momentum, however, with its year-to-date leasing volume of 3.28M SF currently on pace to fall below the 2025 yearly total.
Class A Asking Rents Reach a Record High
Supported by reduced sublease availability, improving tenant demand, the conversion of Class B and C properties to residential use, and upward adjustments to asking rents, Downtown’s average asking rent of $64.46/SF in August 2026 was only 2.0% below the March 2020 average of $65.79/SF and jumped by 8.7%, year over year. Moreover, Downtown’s Class A asking rent of $68.15/SF in August 2026 was a record high. Although pricing has recovered substantially over the past six years, the post-9/11 rent recovery was stronger over the comparable period. By Q3 2007, Downtown’s asking rent of $49.92/SF surpassed the Q3 2001 average of $41.56/SF by more than 20.0%.
Downtown’s Future
Downtown’s resilience has been tested again and again over the years. Although its recovery since the pandemic has been more protracted than the post-9/11 recovery, Downtown now benefits from infrastructure that was not in place during the post-9/11 period, including the Fulton Center and the World Trade Center Transportation Hub, as well as from a more diversified tenant base. New and growing industries may also support the recovery. As of Q2 2026, AI firms had leased 287,000 sq. ft. in Lower Manhattan, providing an early indication of the market’s potential to attract expanding industries.
1 Colliers’ availability rate includes only office spaces scheduled for tenant build-out within 12 months.
2 Colliers’ leasing activity data includes all lease types greater than 5,000 square feet, including new leases, renewals, expansions and occasional sale-leasebacks with a minimum term of 12 months.

 Rachael Rothman
 Marianne Skorupski
 Jeffrey Myers