
Commercial real estate investment activity accelerated sharply in the third quarter, but the headline figures combine activity from two very different markets. Here’s what the latest MSCI data reveals:
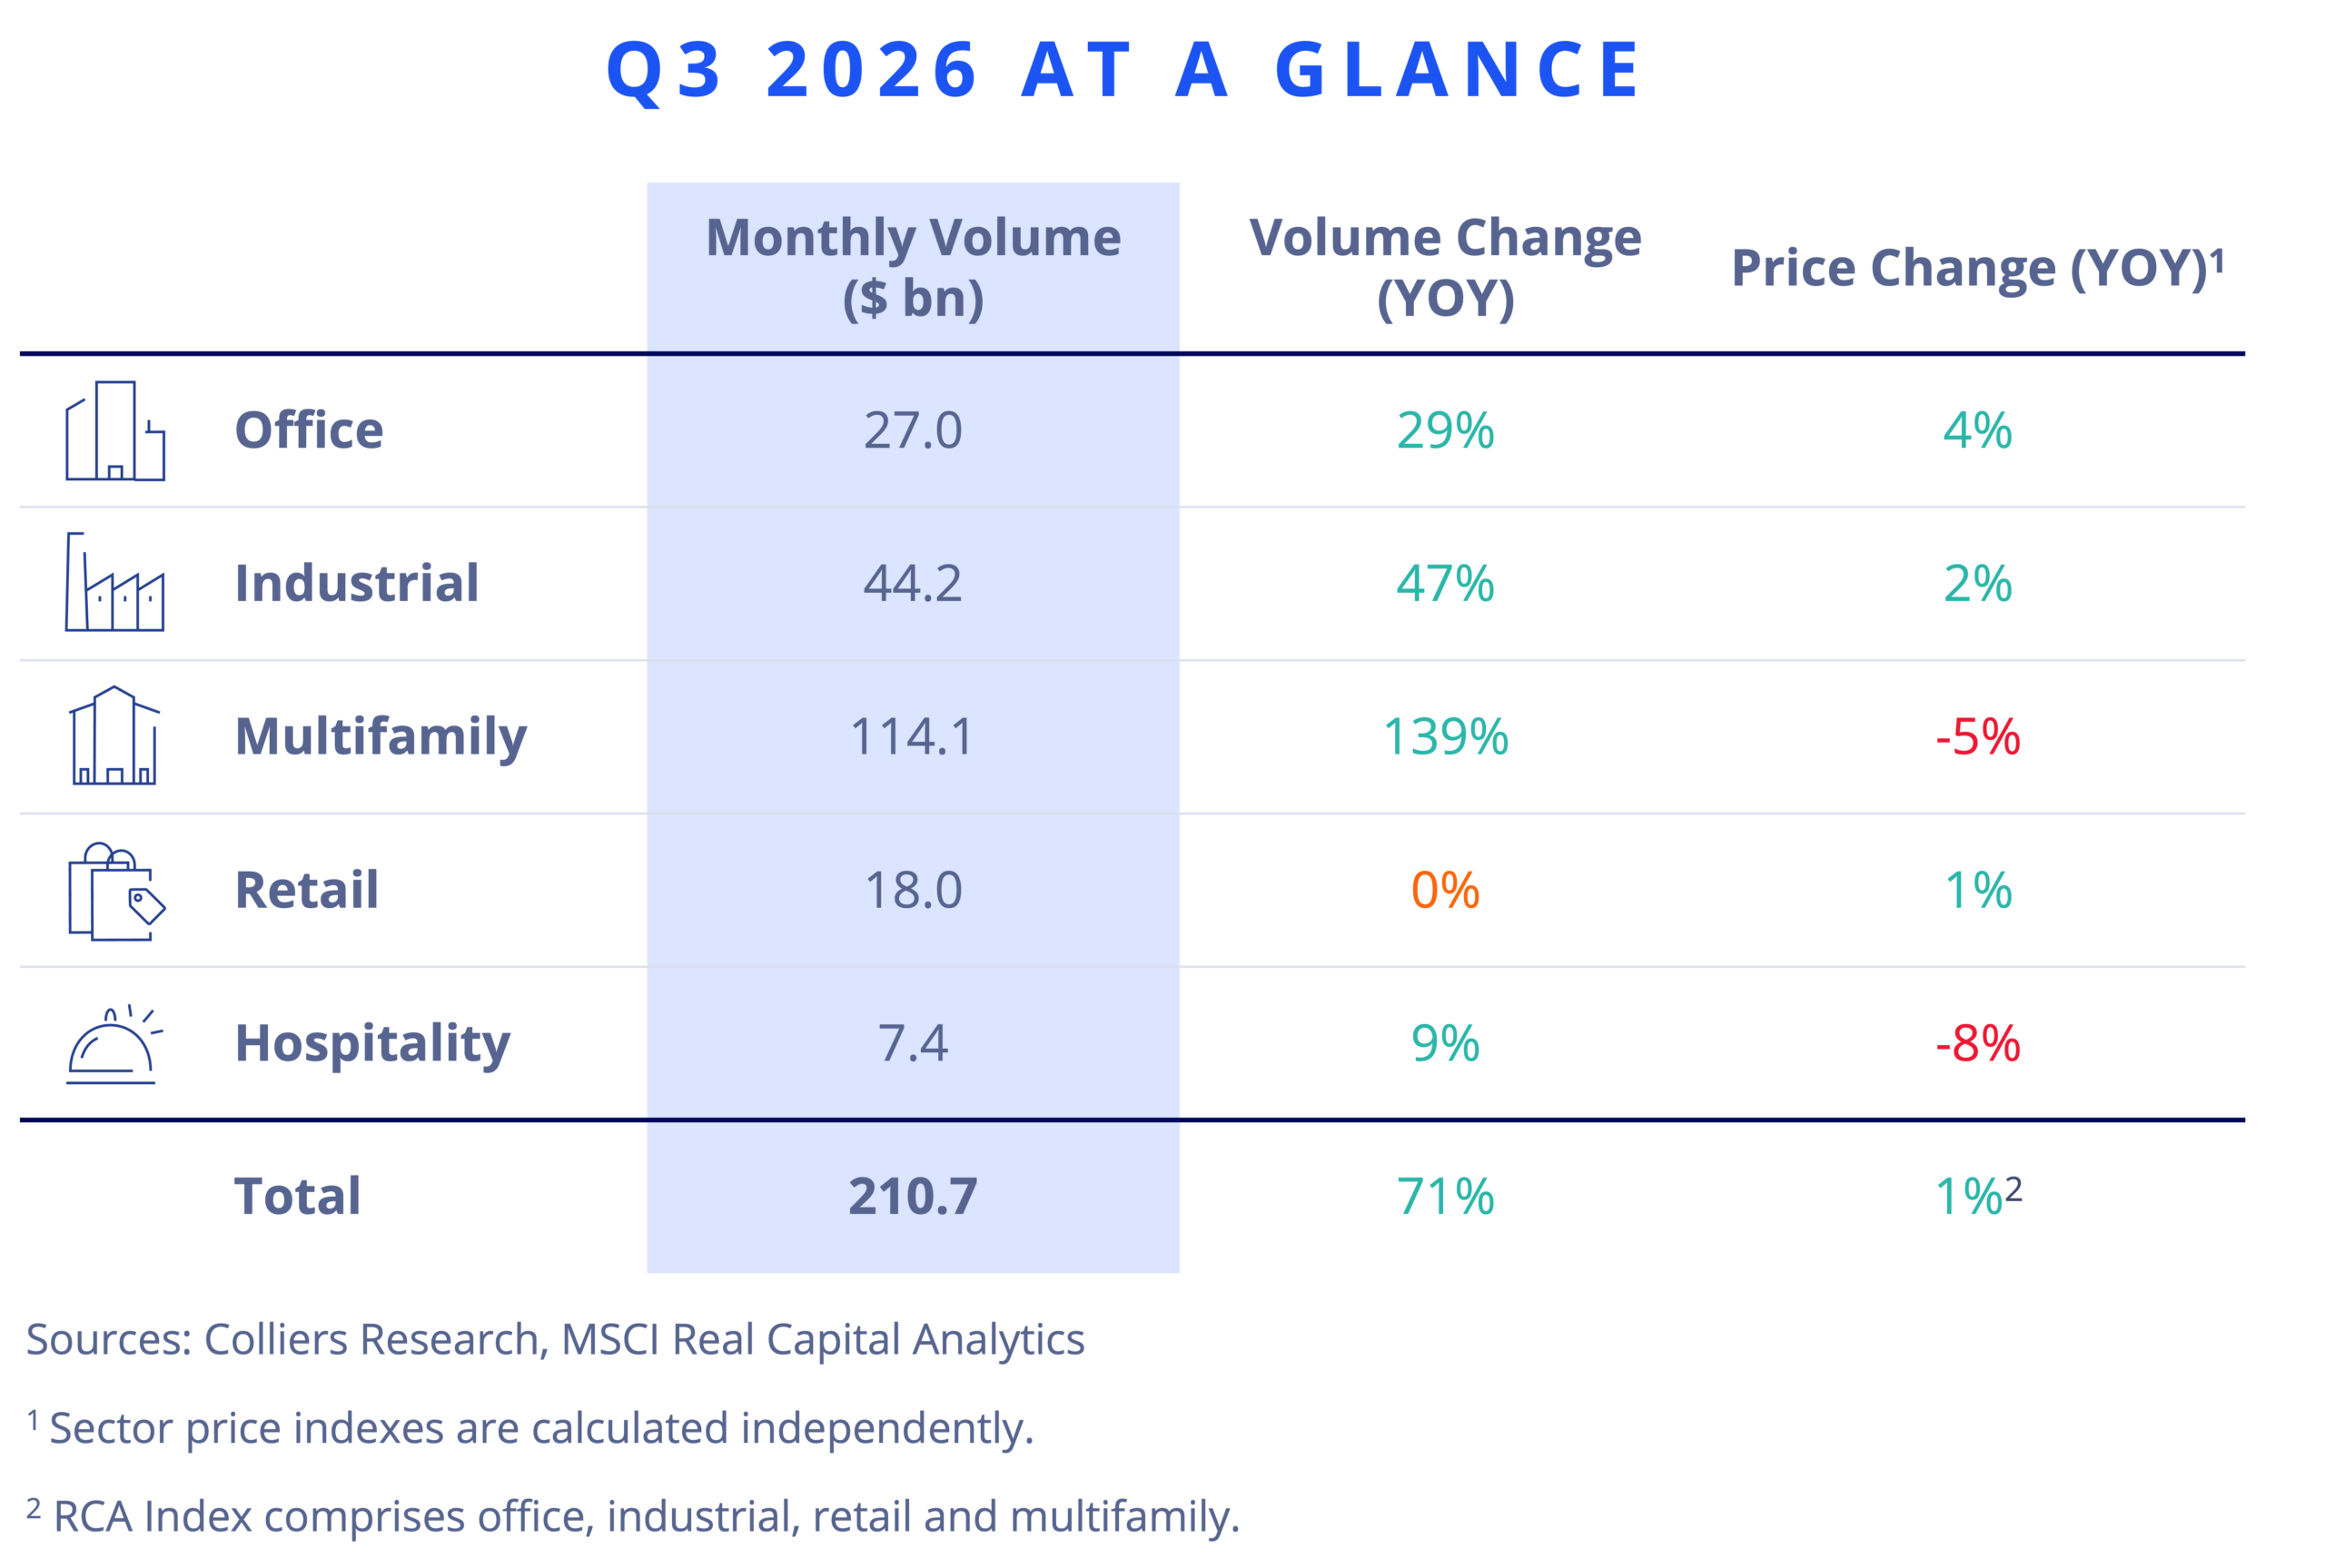
Megadeals drove exceptional top-line growth. The more financing-sensitive single-asset market advanced at a measured pace. Across the five traditional sectors (office, industrial, multifamily, retail, and hospitality), transaction volume totaled $210.7 billion, up 71% year over year. MSCI’s broader property universe, which also includes data centers, senior housing, development sites, and other property types, recorded $263.7 billion in activity, up 89%.
The composition of that growth matters. Across the broader market, portfolio and entity-level transactions rose 468%, accounting for 54% of quarterly volume, while single-asset sales increased just 6%. Record entity-level activity, including the formation of Vivmark and major data center transactions, fueled much of the top-line increase.
The financing backdrop helps explain the divergence. Large entity-level transactions, including equity-funded REIT combinations, were often driven by corporate capital structures and strategic consolidation. Single-asset purchases remained more directly exposed to property-level underwriting, leverage, and elevated borrowing costs. Financing was available, but high base rates continued to raise the hurdle for ordinary acquisitions.
Pricing offered a more modest sign of progress. The RCA CPPI U.S. National All-Property Index increased 0.9% year over year. Office, industrial, and retail values rose, while multifamily and hospitality prices declined. The divide across sectors remains wide, but firmer pricing in several traditional property types should make underwriting and price discovery easier.
Office
Office investment reached $27 billion, up 29% from a year earlier. Growth extended beyond portfolios, with single-asset sales rising 21%. Office prices increased 4% year over year, marking a sixth consecutive quarter of annual gains. Suburban offices carried most of the volume growth, although both suburban and CBD prices increased. New York City, the San Francisco Bay Area, and Dallas were among the markets driving activity.
Industrial
Industrial posted its strongest third quarter on record, with transaction volume rising 47% to $44.2 billion. Growth was broad-based across warehouse and flex properties, as well as single-asset, portfolio, and entity-level transactions. Industrial prices increased 2.2% year over year. Markets driving activity included Dallas, Los Angeles, and Phoenix.
Multifamily
Multifamily volume reached $114.1 billion, but the formation of Vivmark through the merger of AvalonBay and Equity Residential dominated headlines. Entity-level sales accounted for 61% of multifamily volume. Excluding the merger, investment activity declined 7% year over year in the third quarter. Single-asset sales fell 12% year over year, while multifamily prices declined 4.6%. The San Francisco Bay Area, Austin, and New York City were among the markets driving activity.
Retail
Retail investment totaled $18 billion, essentially unchanged from a year earlier, but the mix was more constructive. Single-asset sales increased 7%, extending their run of year-over-year growth to 10 consecutive quarters, while portfolio and entity-level sales declined 43%. Retail prices rose 1.4% year over year. Markets driving activity included Southern California, South Florida, and Seattle.
Hospitality
Hospitality investment increased 9% to $7.4 billion, but Ryman Hospitality Properties’ $1.38 billion purchase of the JW Marriott and Ritz-Carlton at Grande Lakes Orlando accounted for the reported growth. Excluding this transaction, volume would have declined 11%, consistent with the 11% drop in single-asset sales. Hospitality prices remained 8.2% below year-earlier levels, but the pace of decline slowed to 1.0% annualized between the second and third quarters, suggesting pricing conditions may be stabilizing. New York City, South Florida, and Southern California were among the markets driving activity.
 Rachael Rothman
Across MSCI’s broader market, portfolio and entity-level deals represented 54% of Q3 volume, while single-asset sales increased just 6%.