 Sheena Gohil
 Bobby Shanahan
Despite headline-grabbing articles flooding our inboxes with dire predictions about the office market, the data tells a more complex story. While the office sector faces significant challenges for owners and landlords – such as muted demand, elevated interest rates, and looming debt maturities – these pressures are impacting occupiers in a different way. The complexities facing the office sector demand guidance from advisors who are equipped with the latest data and insights to help navigate these challenges effectively.
Falling Asset Value and Rising Distress for Owners and Investors
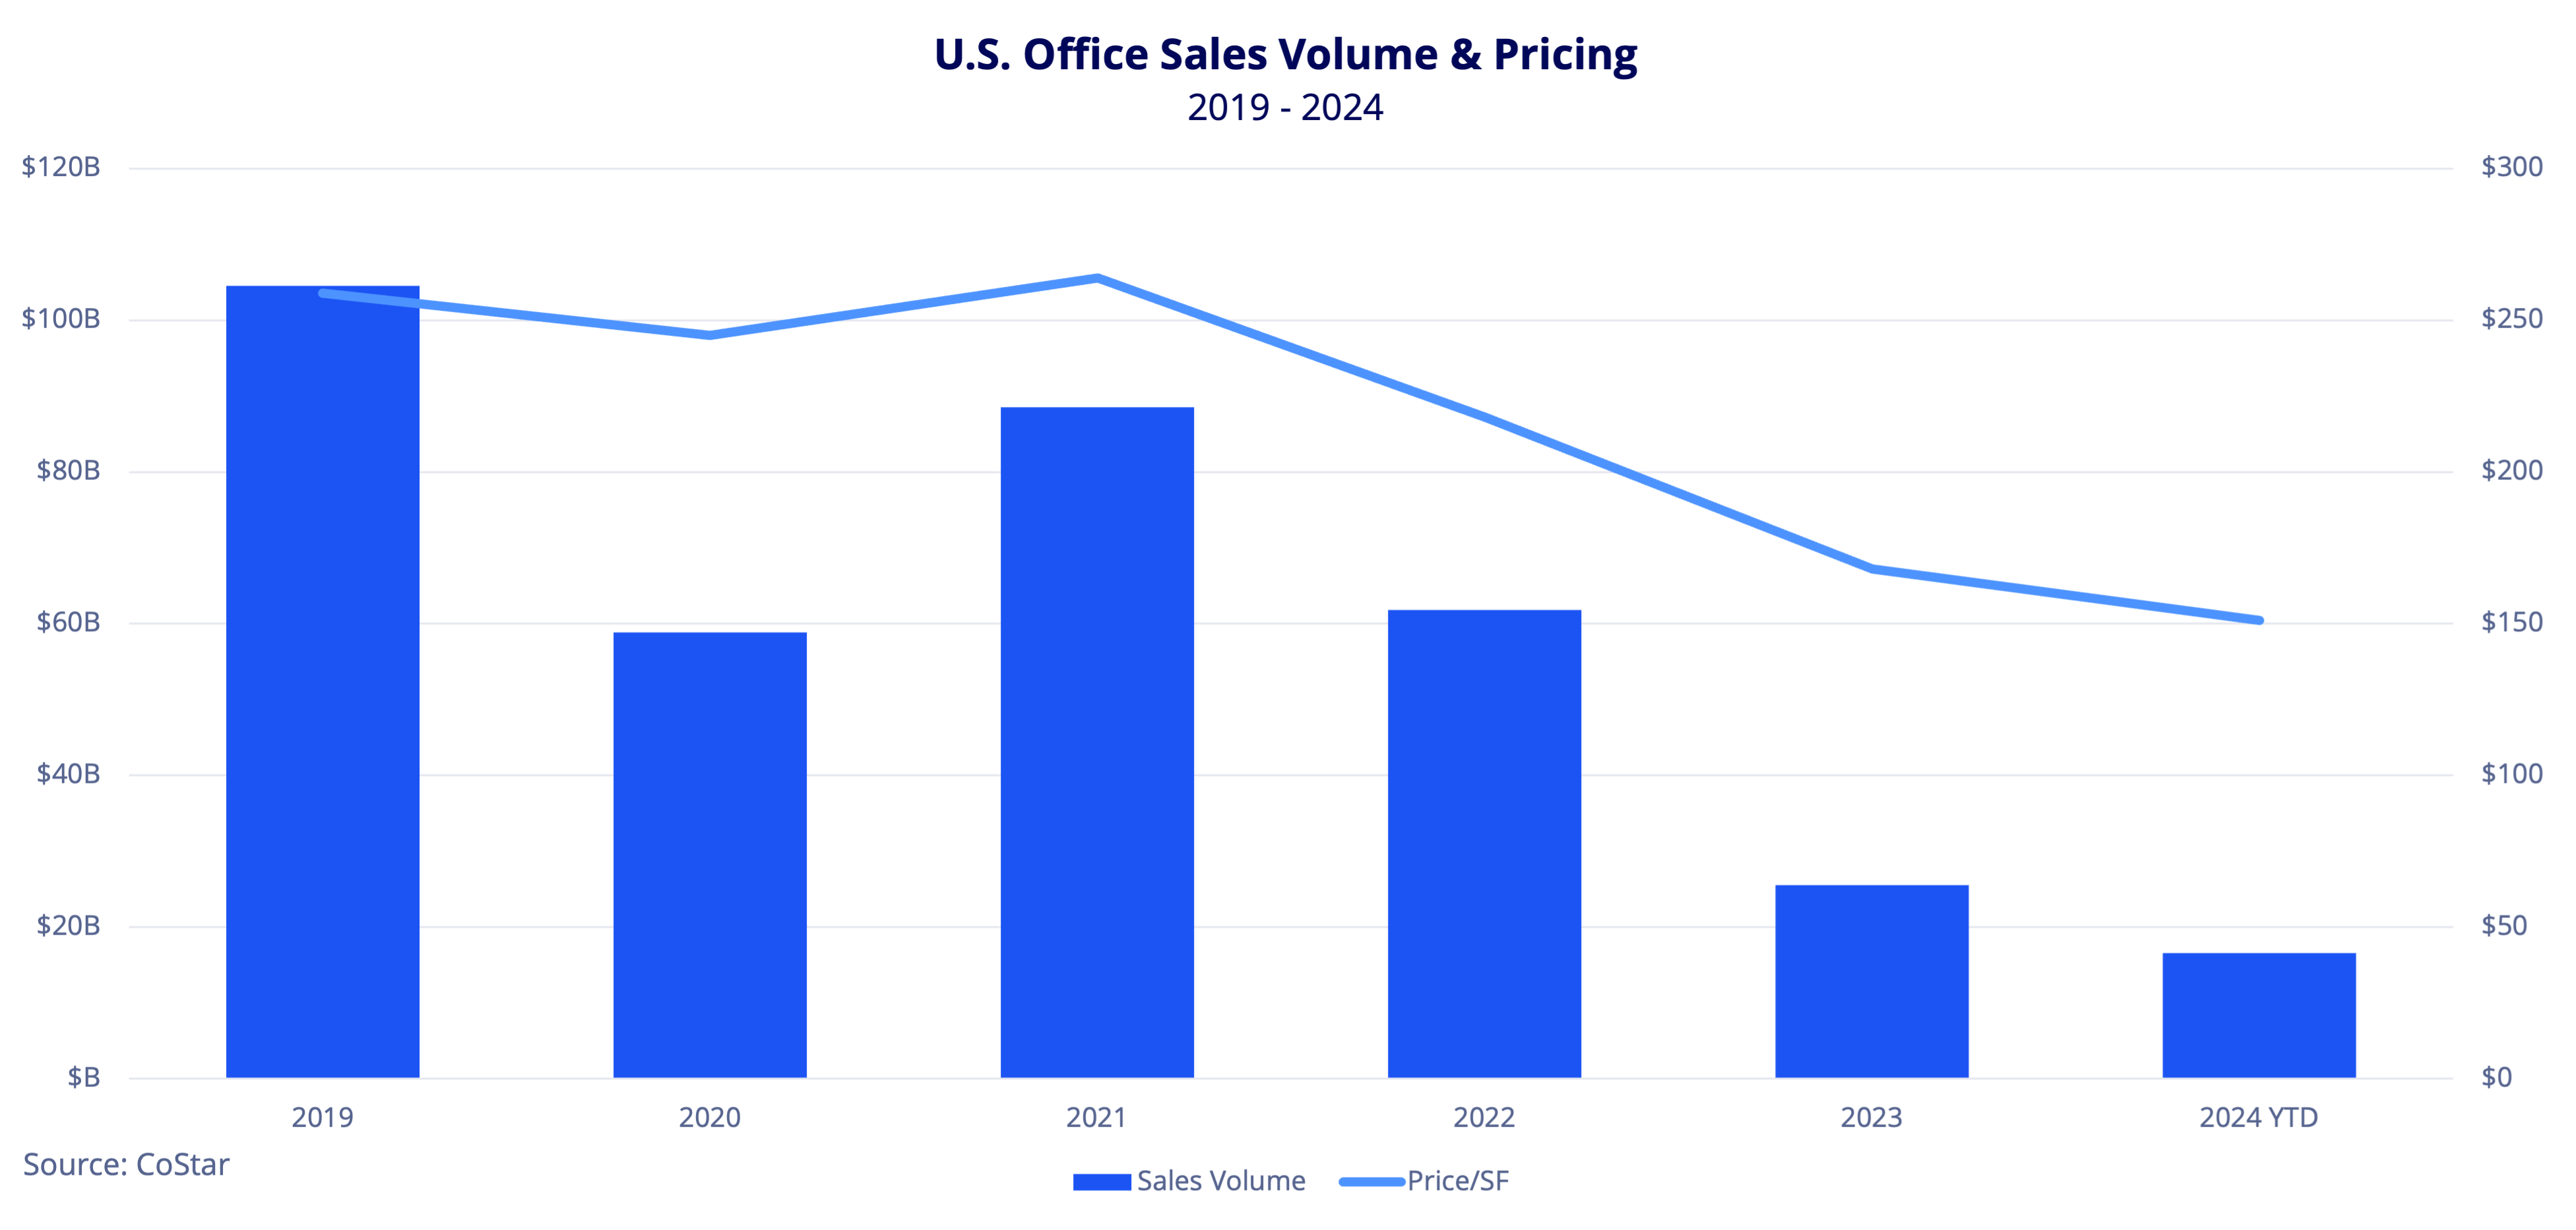
Investor demand for office space has plummeted as vacancies persist and carrying costs remain high. Tenant preferences are shifting to high quality, sustainable, and accessible buildings that accommodate evolving workplace strategies, which require owners to invest significant capital into their assets to remain competitive. Many office properties are now selling at a loss, with some transactions seeing price drops of more than $100 million. Nationally, office asset sale prices have fallen by 42% since 2019, according to CoStar.
Office values are in a reset, with delinquency rates steadily rising. By August 2024, the U.S. office CMBS delinquency rate hit 8.36%, the highest since 2013 and up 278 basis points year-over-year, according to Trepp. As of Q2 2024, $41 billion in office assets were in distress, per MSCI, with an additional $89 billion in office loans maturing in 2024, according to the Mortgage Bankers Association. With over $2.2 trillion in commercial property debt maturities between 2024 and 2027, office market values may continue to adjust for an extended timeline. Given that delinquencies peaked nearly five years after the Great Recession began, a similar prolonged recovery could be ahead for office valuations.
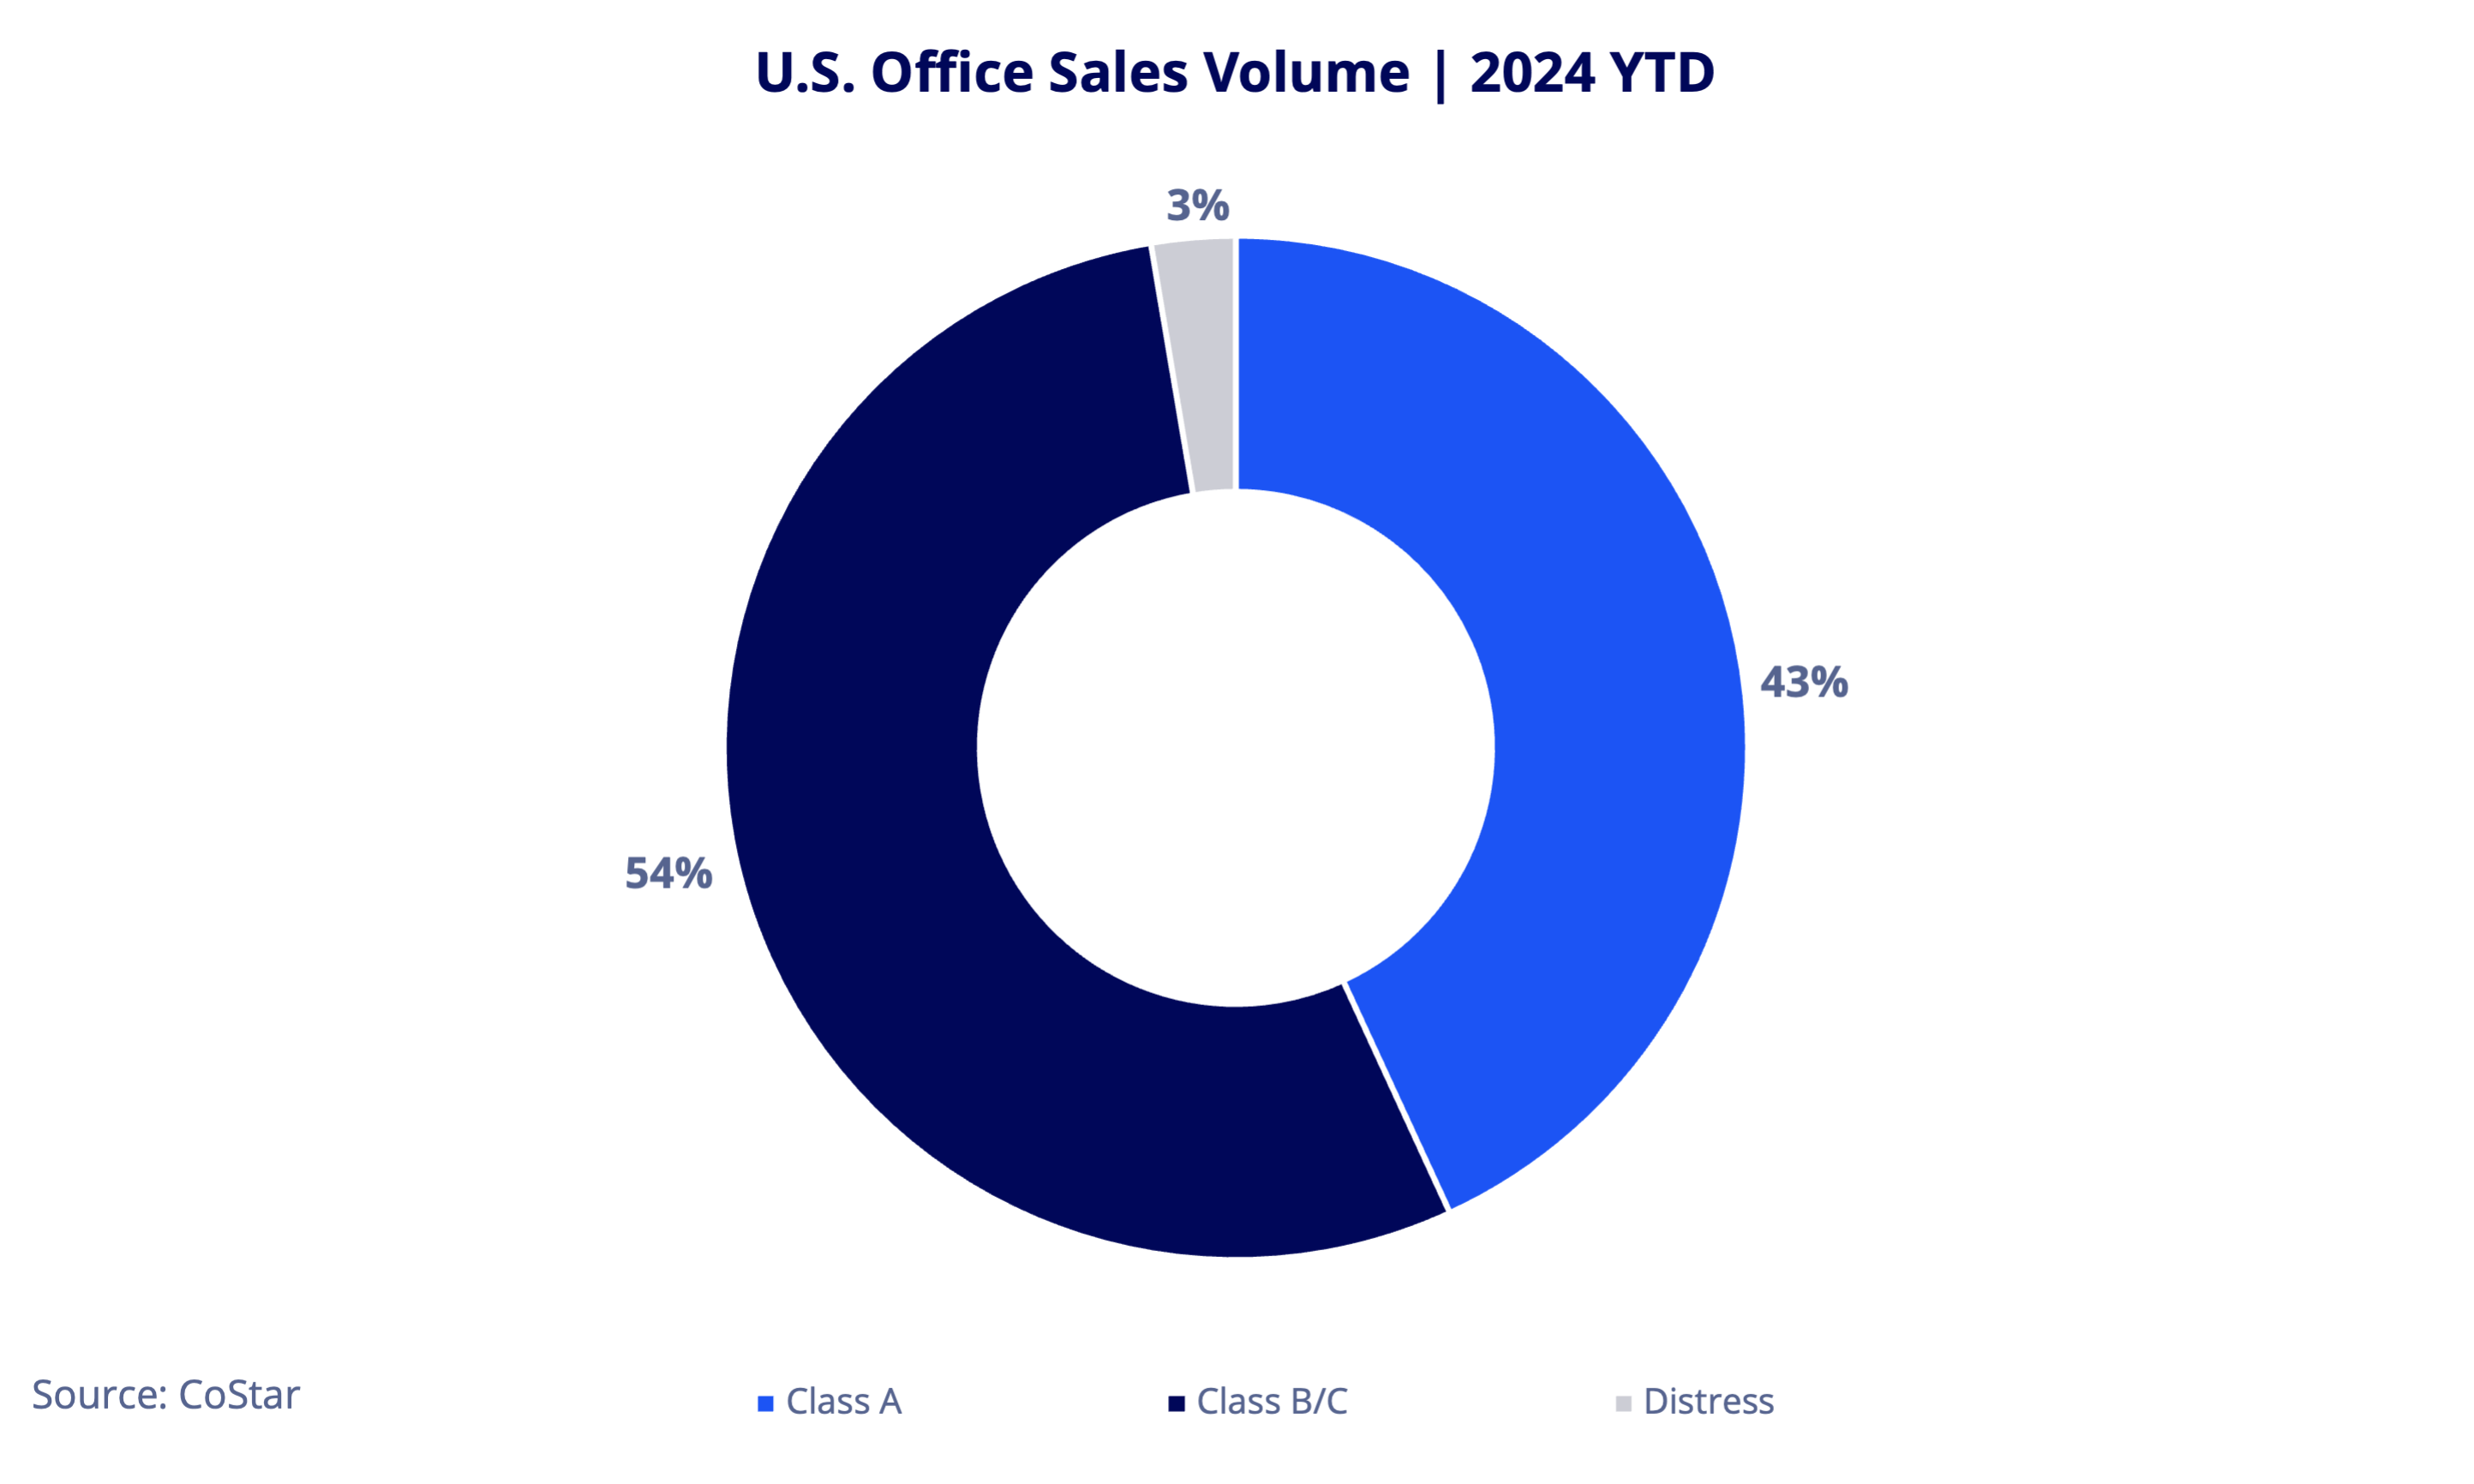
While these adjustments in value make their way through the market, it is important to note that so far, distressed office sales made up only 3% of year-to-date office volume, according to CoStar. Most of the sales volume (54%) this year were Class B or C properties. Investors are still targeting Class A assets, with $7.16 billion, or 43% of total sales volume this year. While Class A properties’ average sale price this year is down roughly 25% from the 2019 to 2022 annual average, the bottom was likely hit last year as 2024’s year-to-date average price is up 10.6% from 2023.
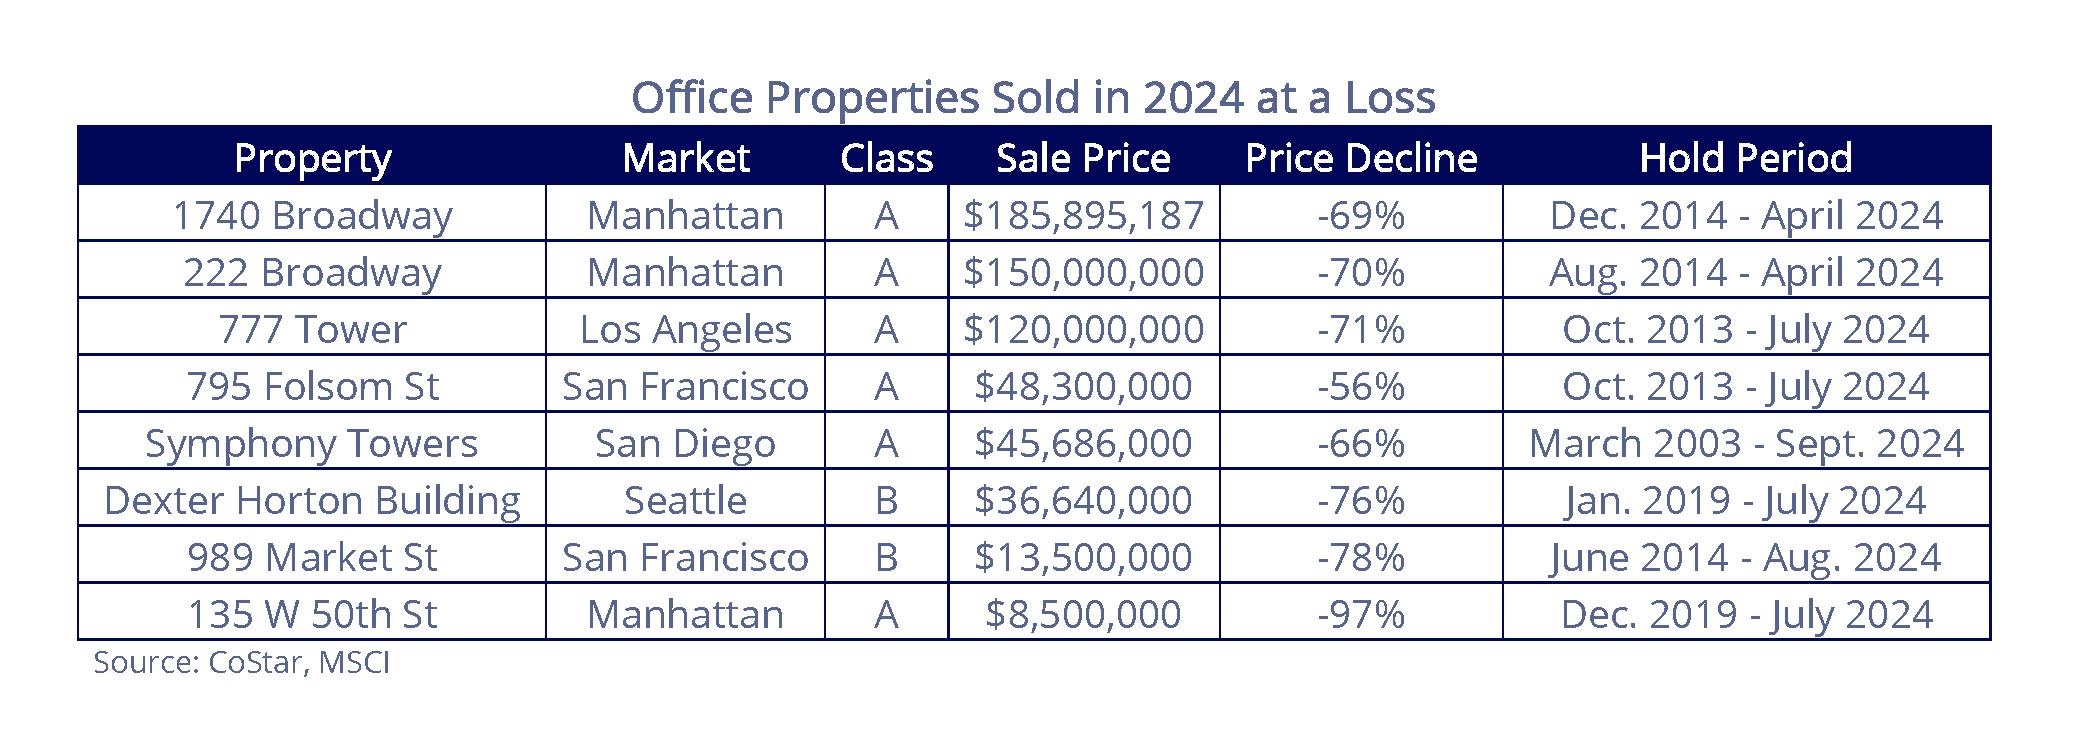
However, the share of discounted sales is accelerating, with 28% of office properties sold at a loss by July 2024, up from 18% in 2023, according to CommercialEdge. Many owners are now accepting significant losses as values decline and market conditions shift. The properties below were sold with low occupancy, sold in lieu of foreclosure or at auction, or were reflective of the decline in value post-pandemic and motivation of the seller to dispose of the property. The average price decline for the following 8 properties was 73%.
Opportunities for Tenants Amid Office Market Distress
Most of the real estate headlines focus on the impact to value for owners, but this value reset has also created opportunities for occupiers; although it’s complicated.
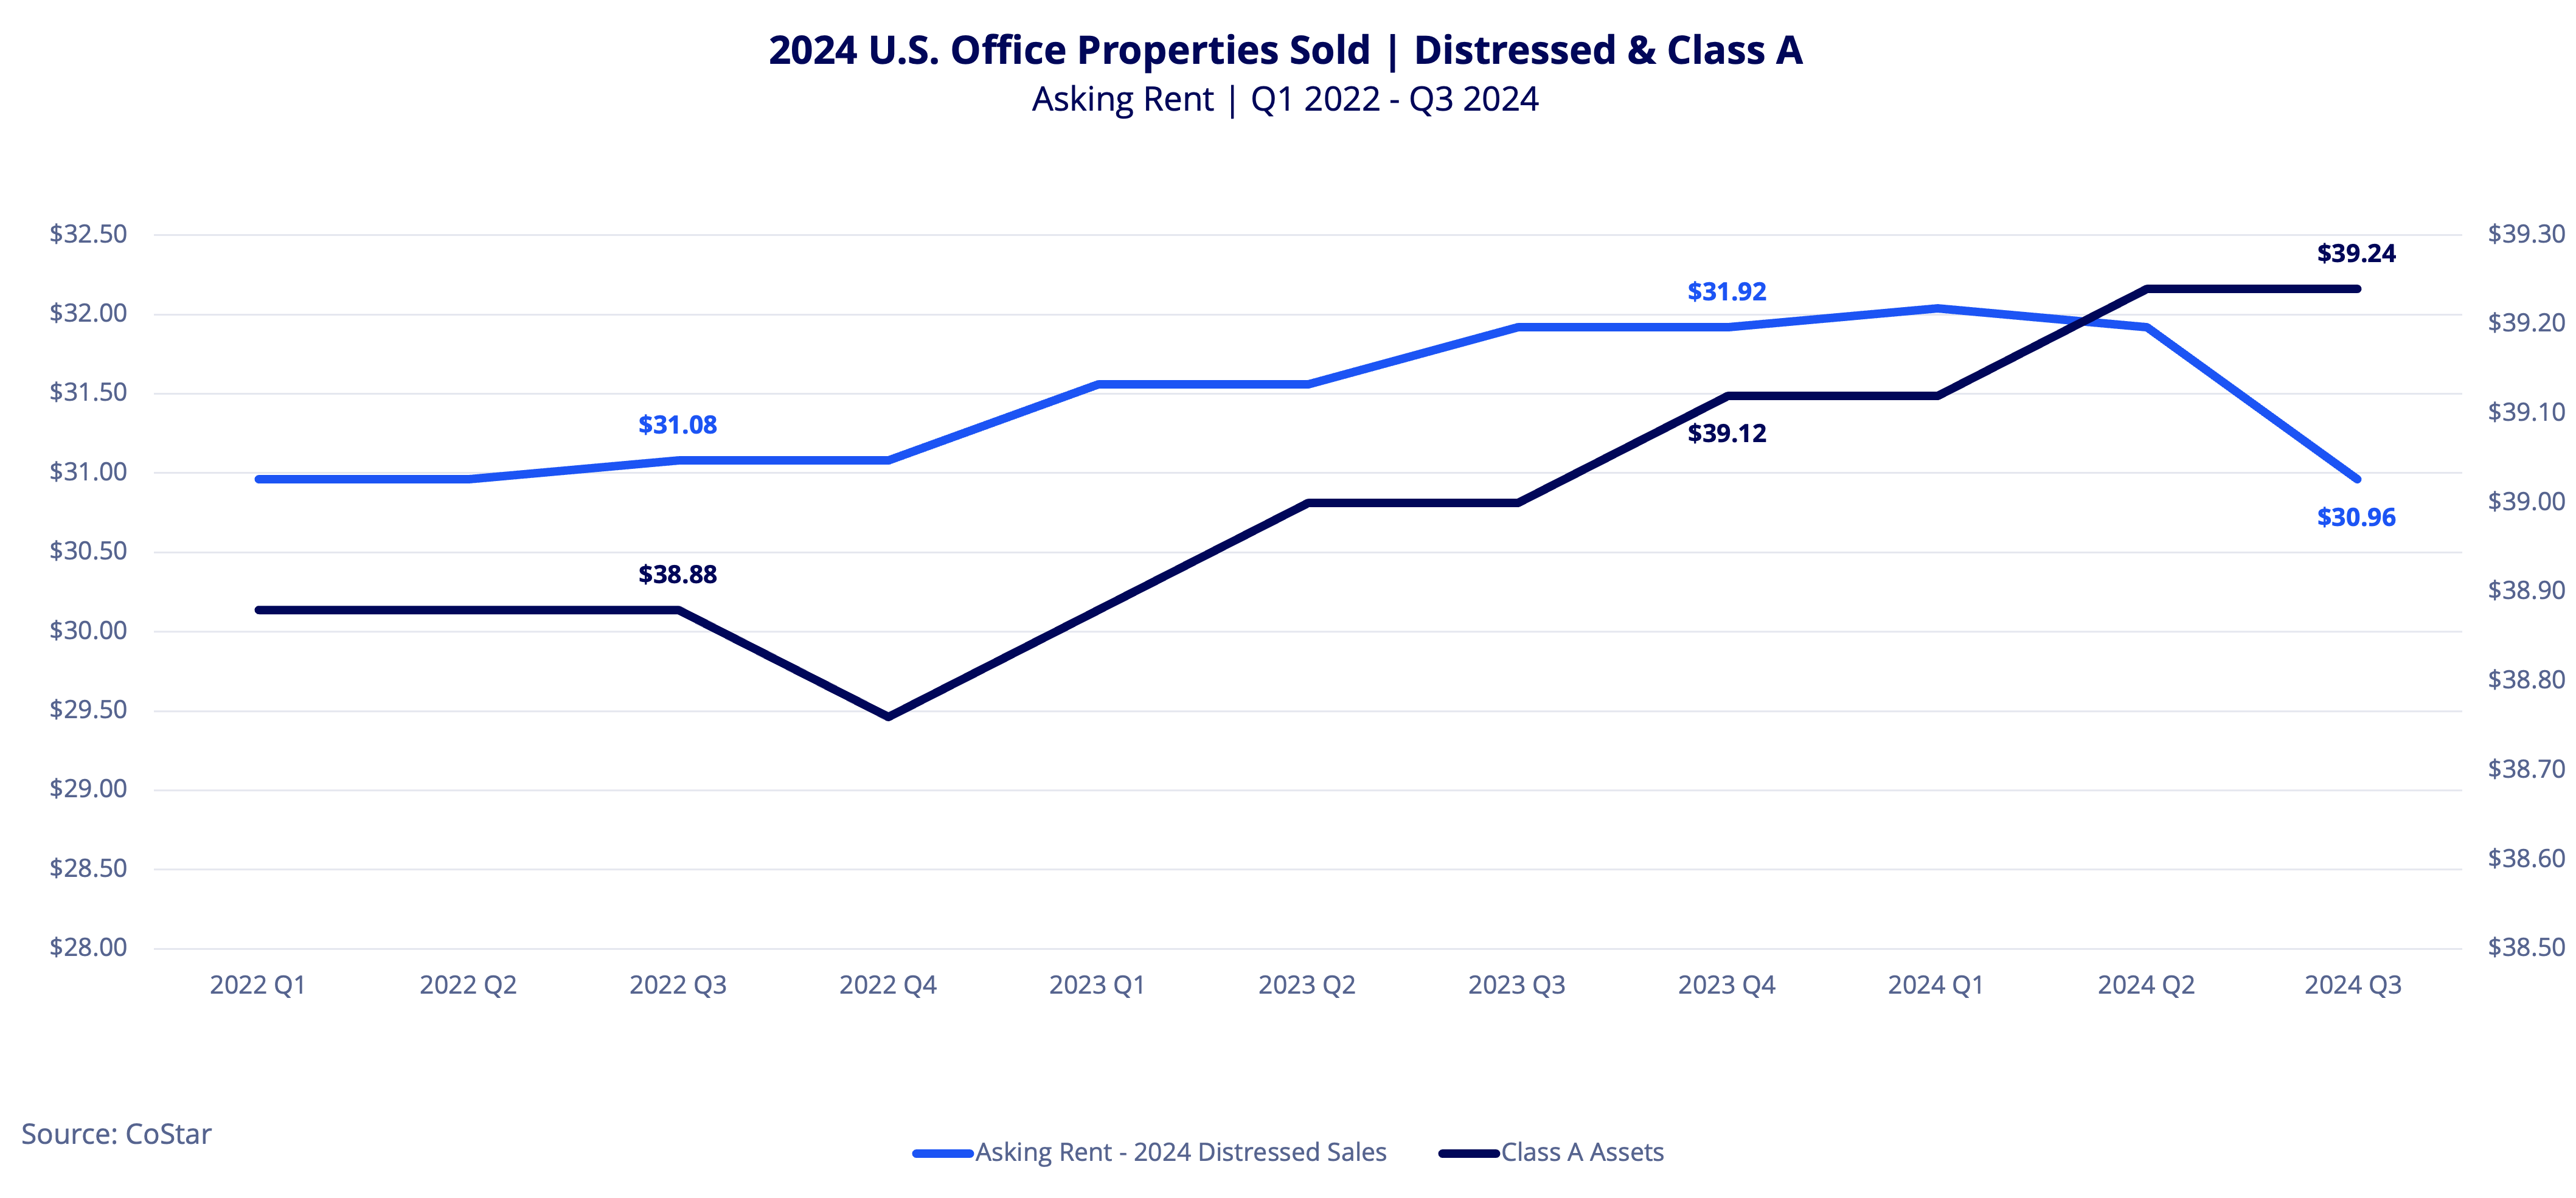
Of the properties purchased in distress so far this year, the average asking rent decreased only 3.0% year-over-year as of Q3 2024 and are level with 2022’s rents.
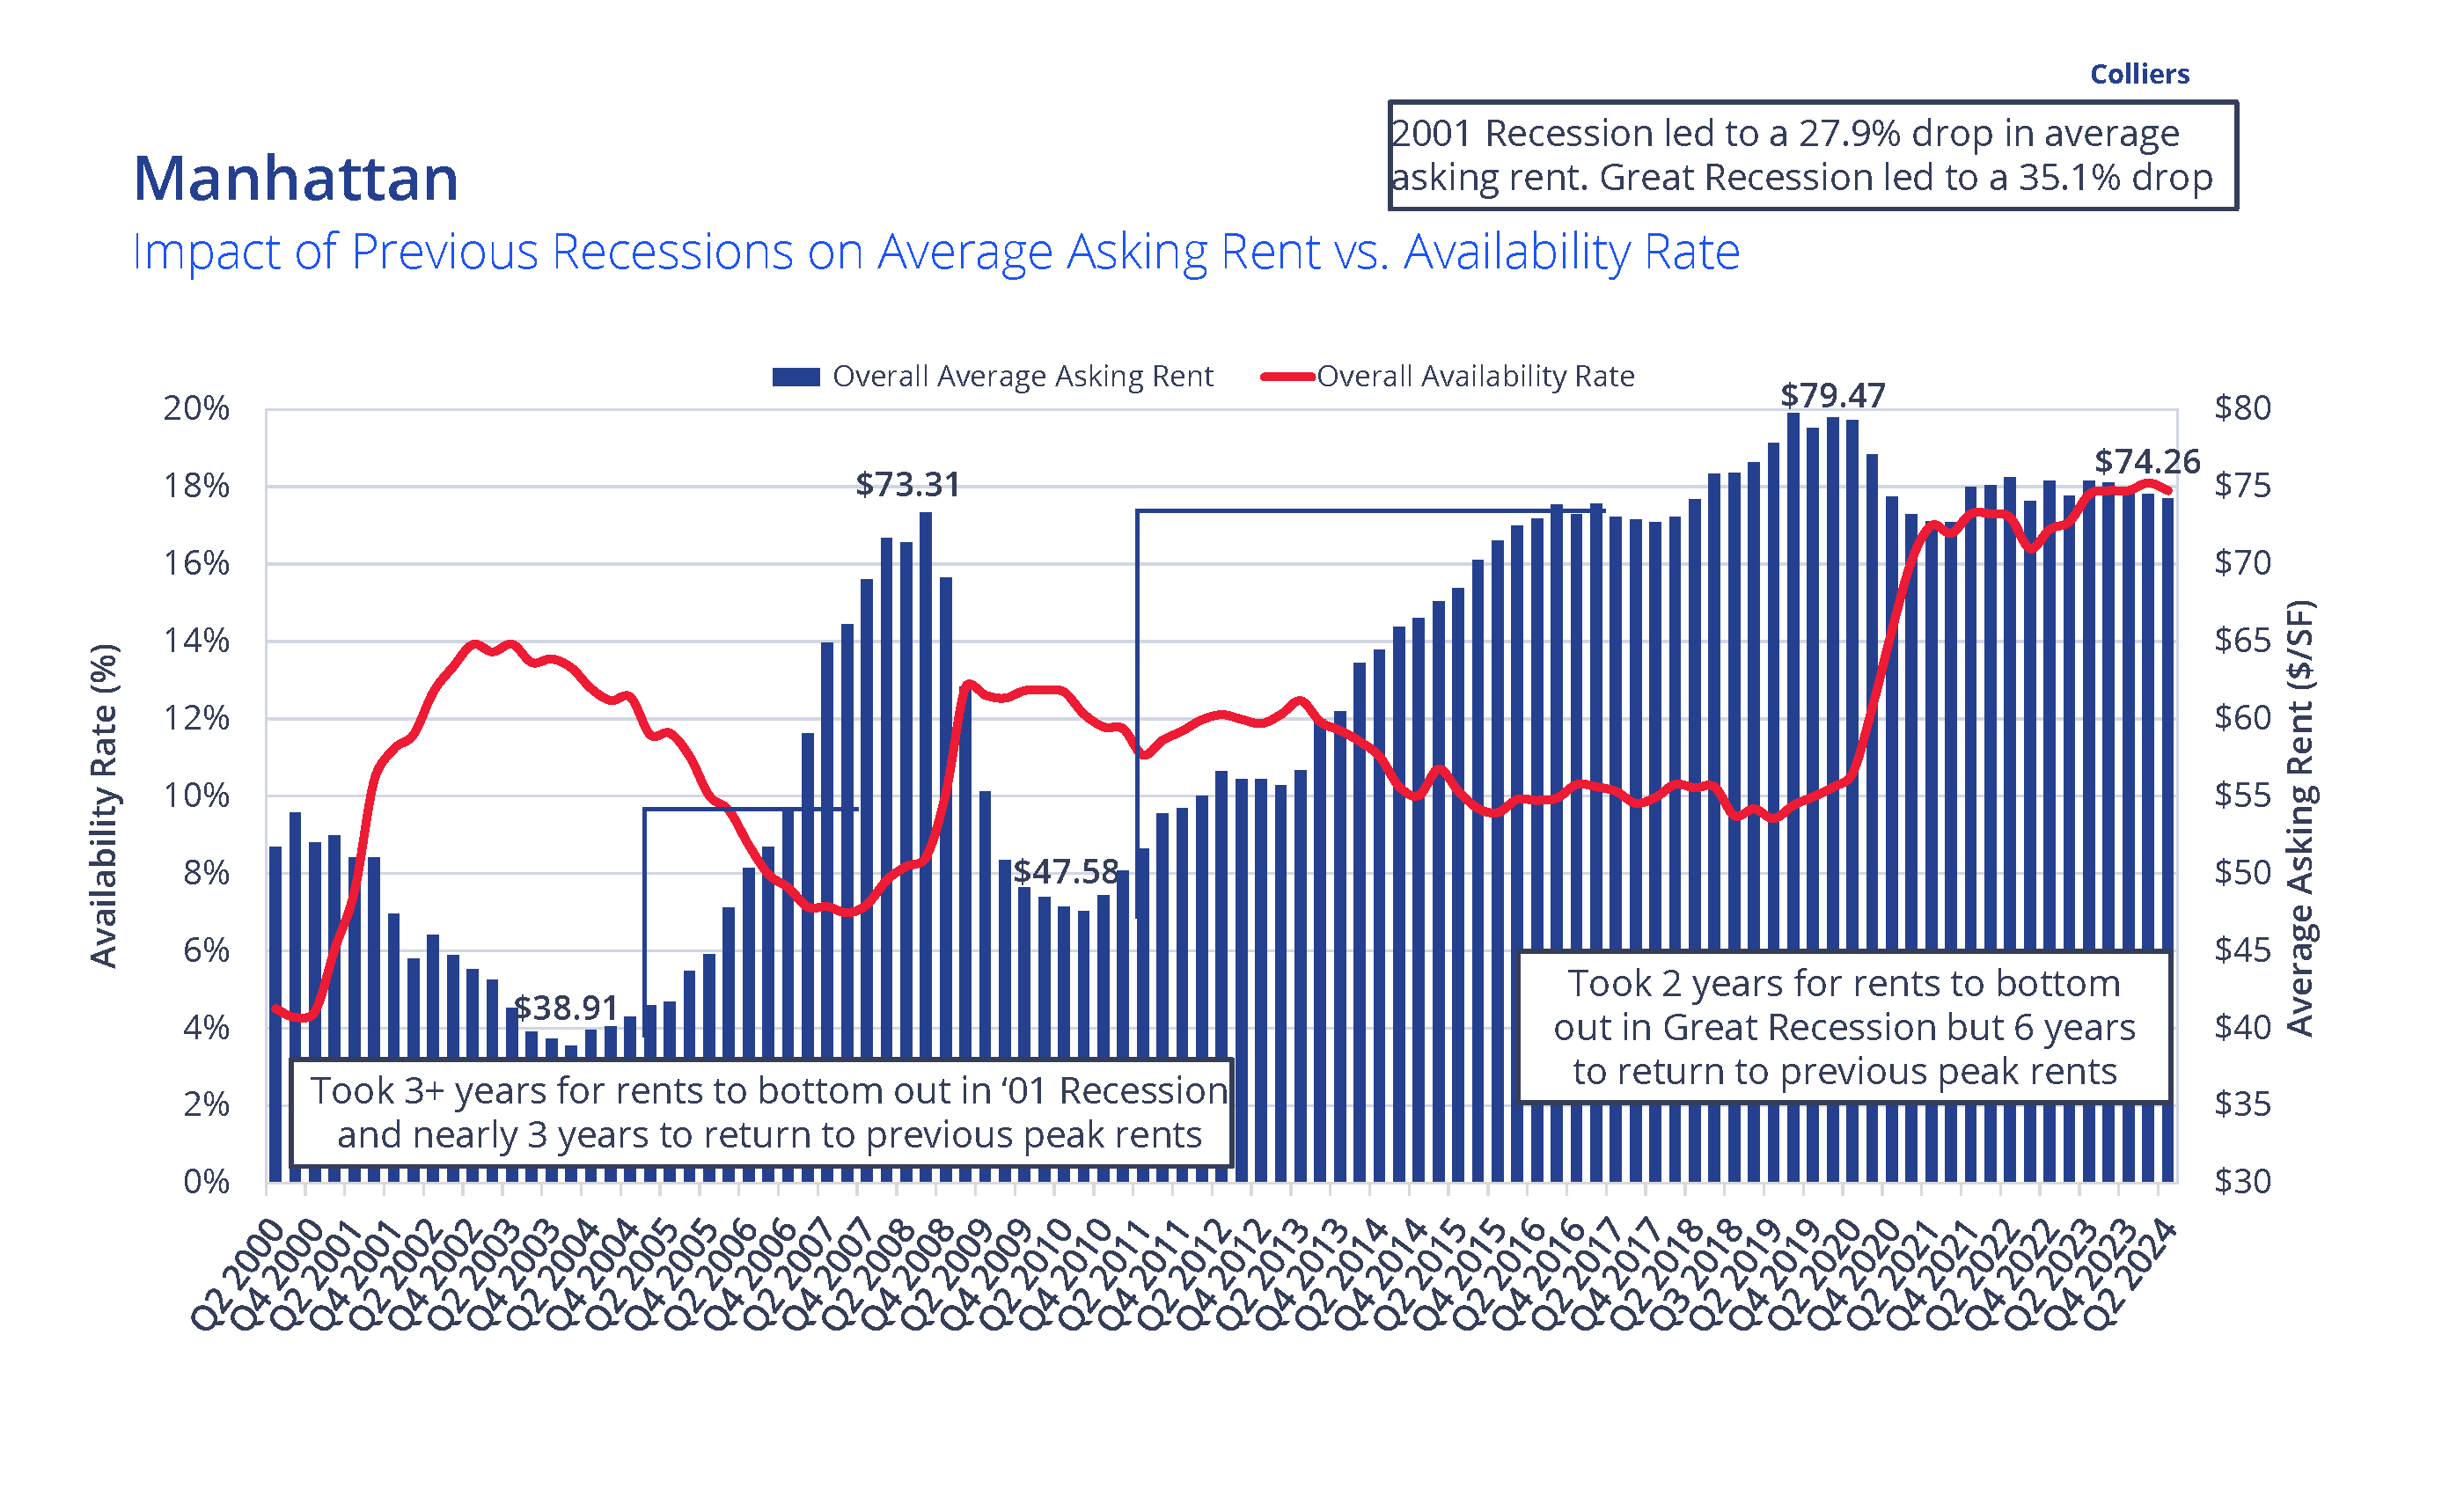
Based on the lower office valuations, and revised underwriting for these assets, we could expect to see further reductions in asking rents. In previous downturns, we saw significant impacts to rental rates, for example in Manhattan:
However, despite the shift in market fundamentals and property values, we have yet to see repricing to the levels of previous downturns. One reason for that is that Class A asking rents have remained firm. Of the Class A properties traded so far this year, asking rents ticked up 0.6% year-over-year, and are up 1.6% in the last three years as landlords hold steady on rental rates.
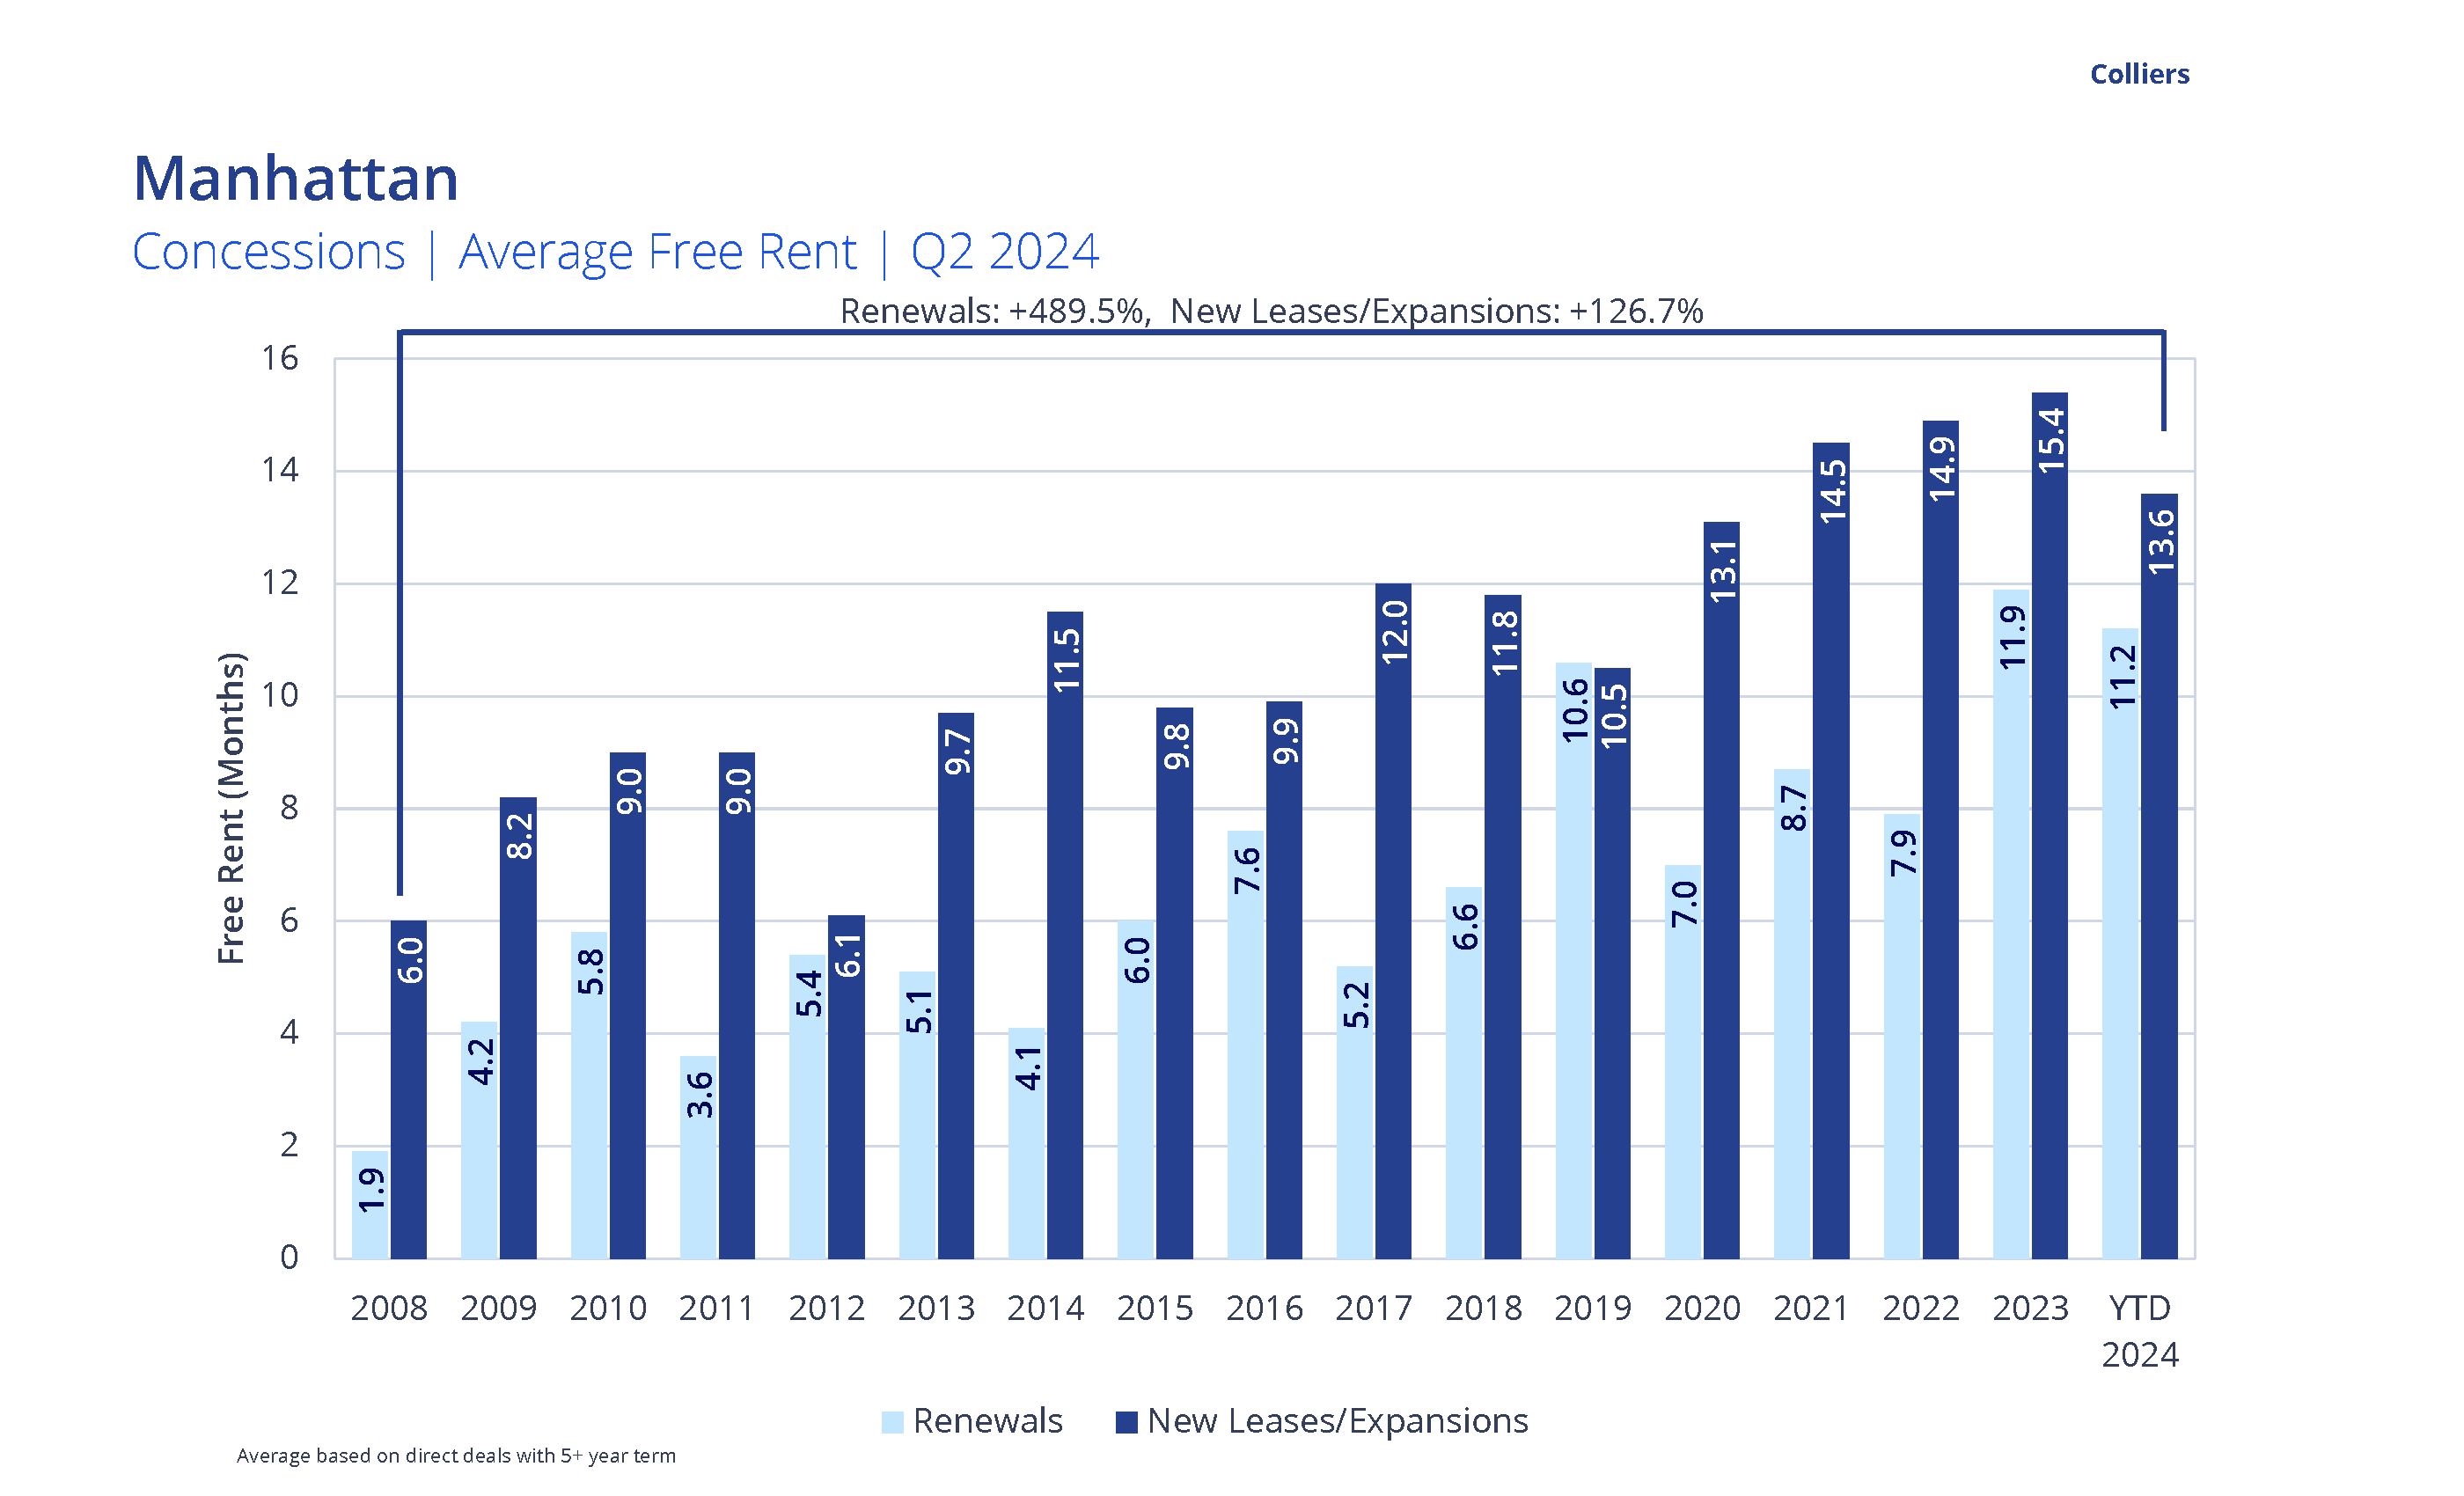
In addition, CBD landlords are offering generous concessions in the form of free rent and tenant improvement allowance to lure companies to their buildings, and which continues to limit asking rent adjustments. Nationally, concessions packages were at an all-time high as of Q2 2024. According to Colliers data, the average free rent on a new five-year direct office lease in Manhattan rose to 15.4 months last year before coming down to 13.6 months so far this year, compared to 9.8 months in 2015.
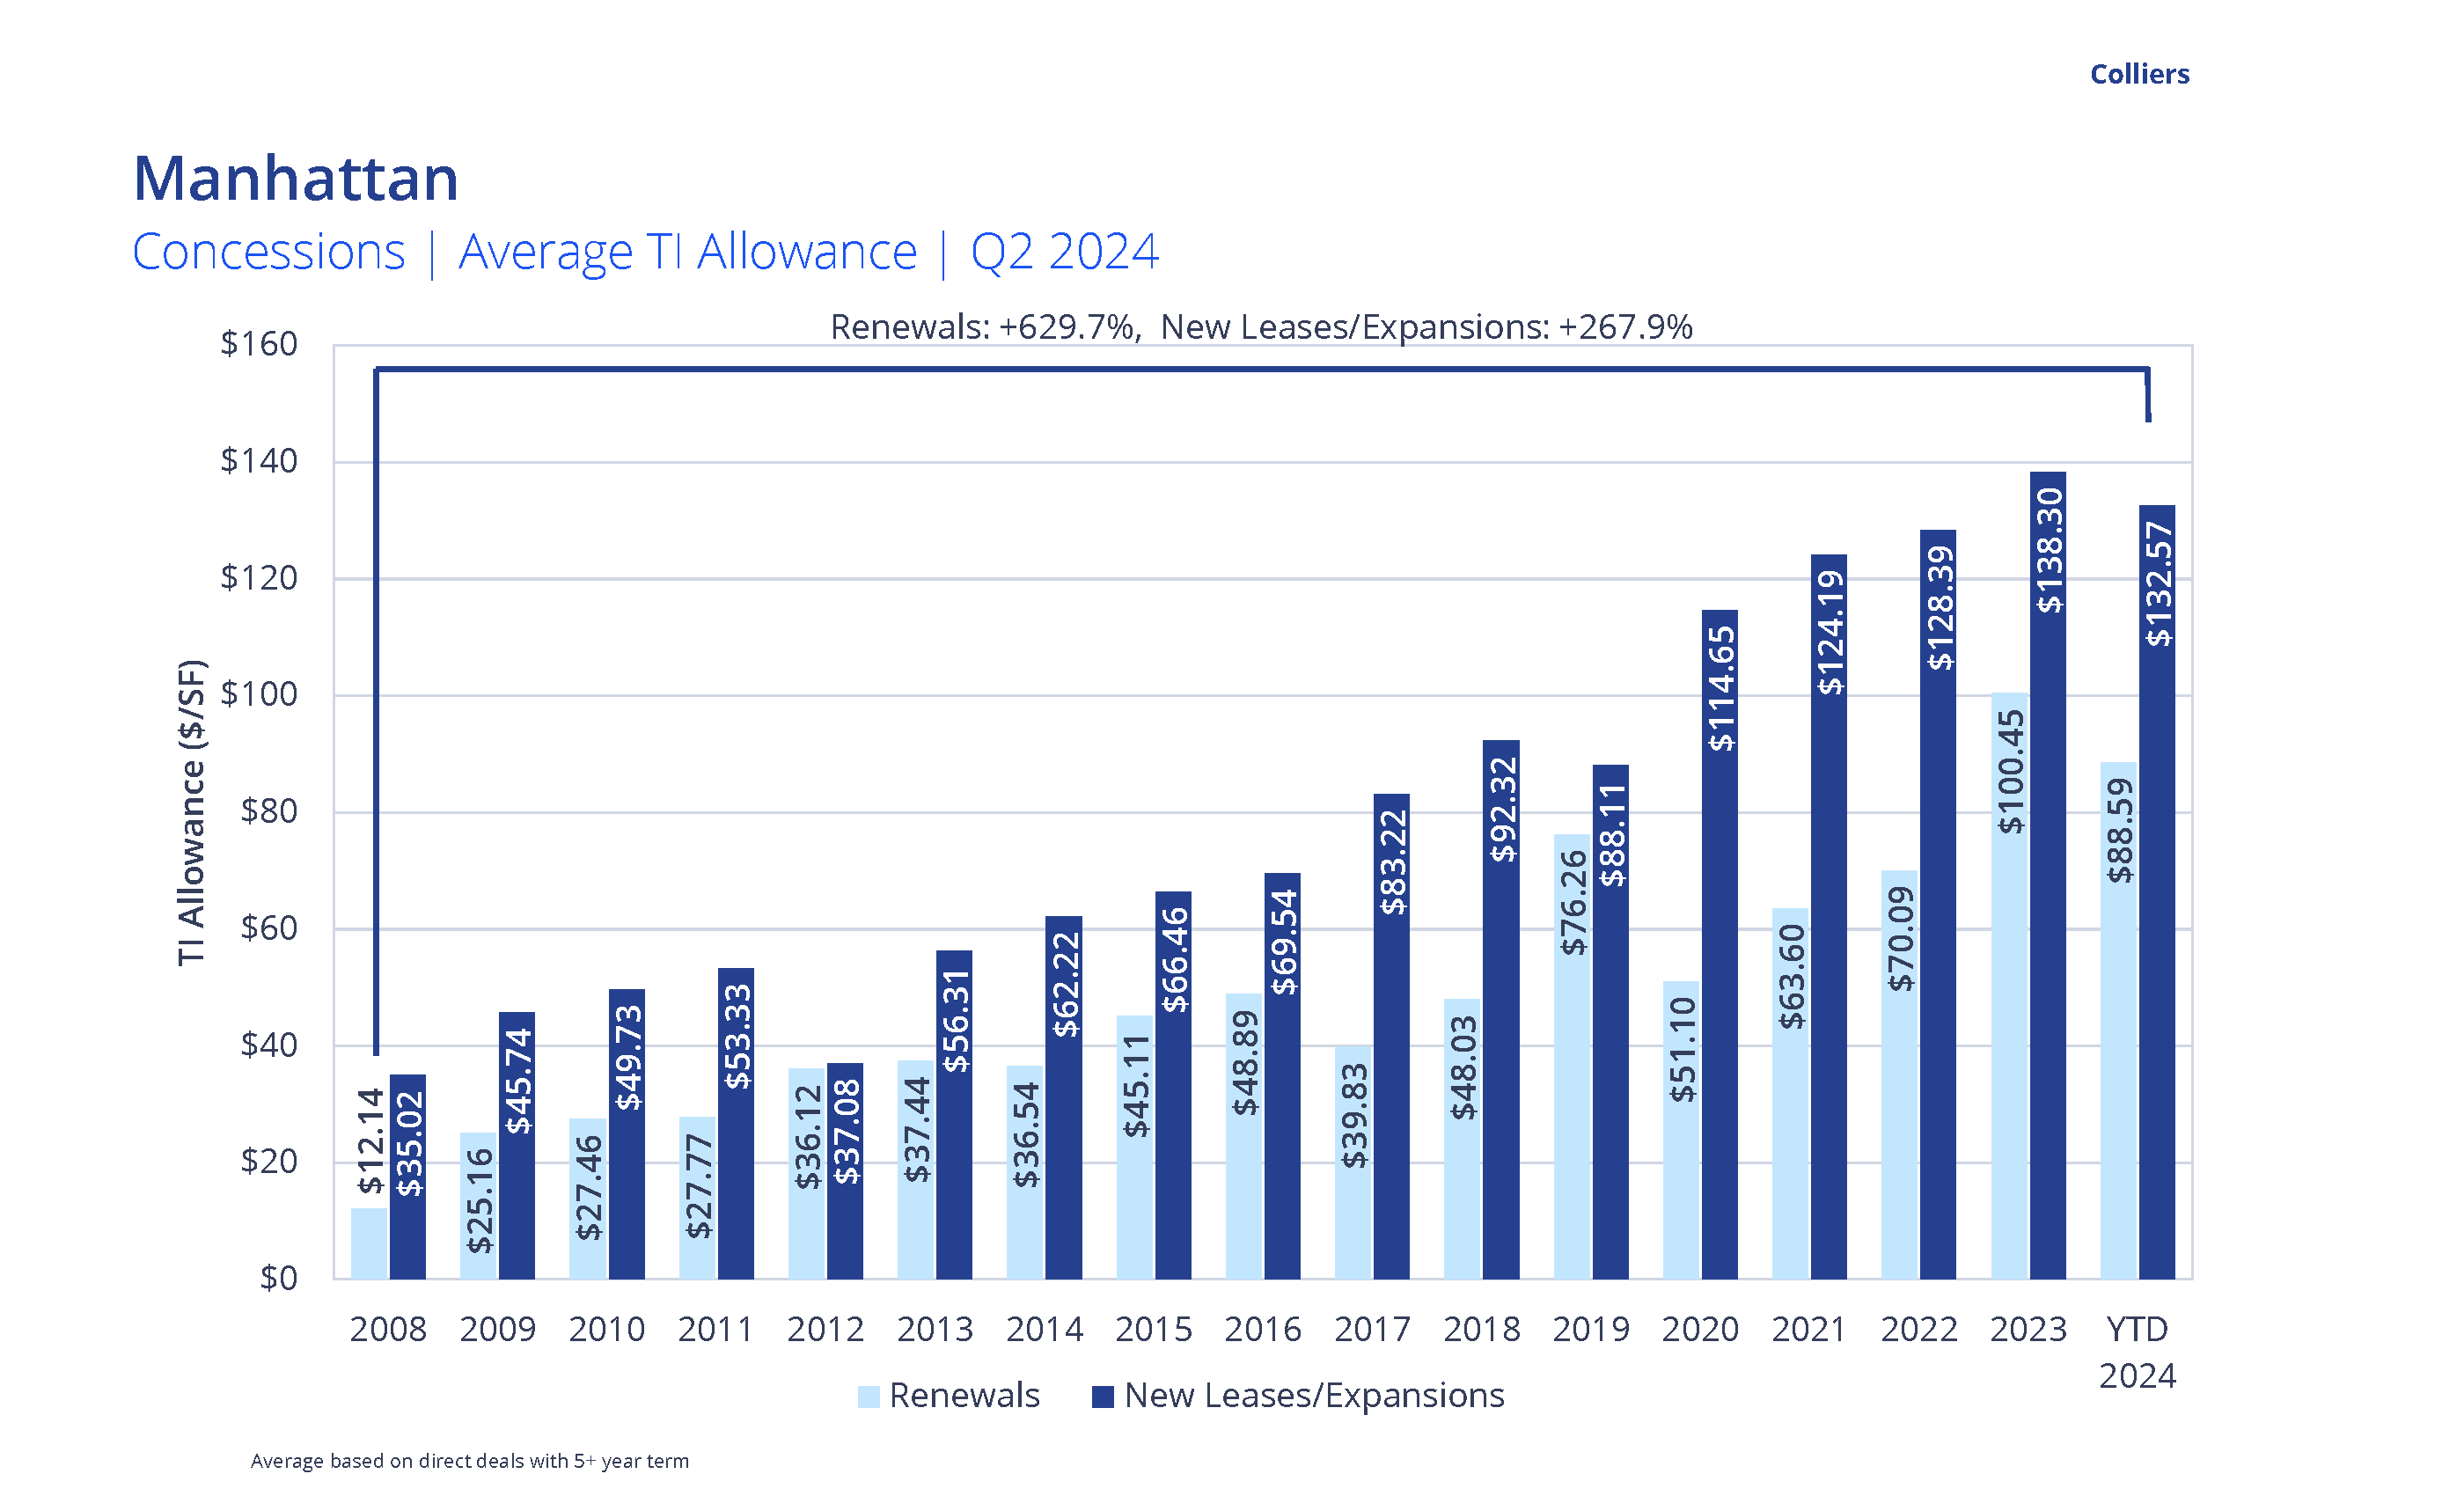
Additionally, tenant improvement allowances in Manhattan have doubled since 2015 from $66 per square foot to around $133 per square foot this year.
In the current market, tenants face a more intricate landscape where relocations and new leasing decisions are increasingly challenging. The complications arise from several factors, including the heightened capital requirements for new construction and the tightening availability of well-located amenitized Class A properties. As a result, more tenants may find themselves renewing leases rather than relocating, as the financial and logistical hurdles of moving to new spaces grow. Renewal conversations between landlords and tenants are now occurring earlier due to the capital investments required to modify office spaces to accommodate hybrid work.
This environment underscores the critical need for experienced advisors who can guide tenants through these challenges, ensuring they make informed decisions that align with their long-term business strategies. Tenants need to evaluate the financial health of landlords and determine whether they can fulfill obligations like tenant improvement allowance, free rent, debt payments, and operating expenses. Landlords facing lower occupancy rates and limited refinancing options are experiencing reduced cash flows, impacting their ability to remain competitive in a challenging marketplace. One way for a tenant to know a landlord’s financial situation is to find out their debt service coverage ratio (net operating income / annual debt service). Any DSCR below 1.2 can be problematic. Other vital information to retrieve from the landlord is its equity position on the property, mortgage status, debt and equity financing, and the landlord’s cash position. Landlords with no debt on their building and strong cash reserves will be most attractive to tenants.
Stabilization Emerging Despite High Vacancy and Price Declines
Despite significant price cuts, there are signs of improvement in the office market. Manhattan and San Francisco are seeing stabilization, with obsolete inventory being removed and new demand drivers emerging. National office utilization, at 72% of July 2019 levels, according to Placer.ai, is gradually rising. While some tenants have yet to face lease expirations since 2020, national sublease availability has dropped for four consecutive quarters after peaking one year ago. More distressed properties still need to sell, which will result in losses for equity holders and lenders. This could bring further complexity as new landlords enter the market.
At mid-year 2024, the U.S. office vacancy rate hit a record 17.6%. But a portion of this vacancy is obsolete or requires substantial upgrades. Excluding older, underused buildings that are challenging to demise (totaling 168 million square feet of vacant space), the vacancy rate would drop by 185 basis points to 15.7%, below the post-GFC peak of 16.3%. This dynamic creates another challenge for occupiers, as they will need to monitor local market conditions to be prepared for any changes that may affect their buildings and require a relocation. While the worst might be behind us, market fundamentals remain in the tenants’ favor. Leasing activity has picked up in the first half of 2024 and should improve occupancy rates in the next 12 months. The decline in new construction starts and the ongoing flight to quality will also tighten top-tier, Class A office availability and lead some tenants to renew because of the lack of higher quality space options.
The Colliers Tenant Advisory Council (TAC) is a specialized group of top advisors dedicated to guiding corporate occupiers through the evolving commercial real estate landscape. Comprised of about 100 members across 50 cities, TAC focuses on best practices, collaboration, and resource sharing to deliver exceptional tenant representation. As businesses face uncertainty, change, and complexity, TAC leverages deep local market insights and strategic expertise to help clients navigate challenges and develop agile real estate strategies that align with their core business goals.
Presented by Colliers Tenant Advisory Council. Click the links below to view our previous posts:

 Anjee Solanki
 Mike Spears