 U.S. National Research
The Q4 2021 numbers are in and, once more, the signs are encouraging for the U.S. office market. The vacancy rate is starting to tick down, the amount of sublease space is slowly falling and net absorption was positive for the second successive quarter.
The U.S. office vacancy rate now stands at 14.8%, a fall of 10 basis points in the fourth quarter. If this does represent a leveling off for this cycle, it will be comfortably below the record peak of 16.3% seen at the height of the Global Financial Crisis.
Sublease space has been a key contributor to the increase in vacancy. There is now 199.7 million square feet of sublease space available across the U.S. office market, down from the record 208.8 million square feet posted in Q2 2021. While this remains significantly higher than the prior peak of 143.3 million square feet seen in Q2 2009, the fourth quarter saw the amount of sublease space fall for the second successive quarter.
Supply, Demand and Vacancy: Q4 2018 to Q4 2021
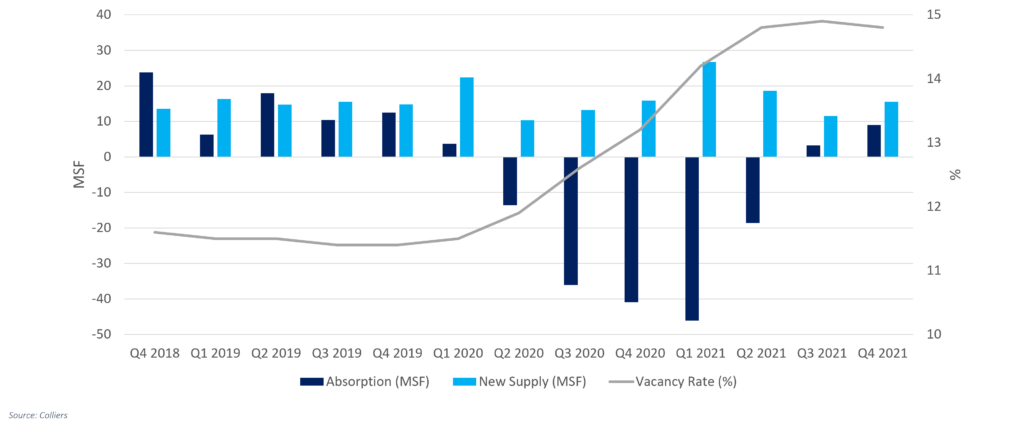
Net absorption, which measures the change in occupied office inventory, continues to turn positive in an increasing number of office markets. In Q3 2021, 56% of office markets saw positive absorption. This share rose to 61% in Q4 2021.
Net absorption was in positive territory at a national level for the second quarter in a row. U.S. office net absorption in Q4 2021 was an encouraging nine million square feet, up from 3.2 million square feet in Q3 2021. This represents a significant turnaround from the cumulative 153 million square feet of negative absorption seen between Q2 2020 and Q2 2021.
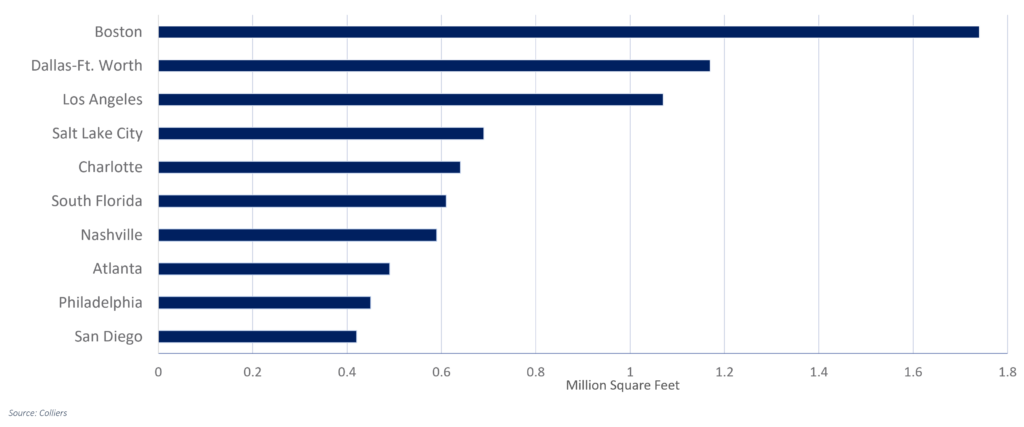
Three metro office markets posted more than one million square feet of positive absorption in Q4 2021: Boston, Dallas-Fort Worth and Greater Los Angeles. Charlotte, Nashville and Salt Lake City also saw strong gains. However, Chicago remains the most challenged major office market, again posting more than one million square feet of negative absorption.
Leading Office Markets For Positive Absorption
Construction activity continues to slow. There is 120.5 million square feet currently underway, which is down 27% from this cycle’s peak of 164 million square feet, seen in Q3 2020. The New York metro area has by far the largest amount of ongoing construction, at 24.3 million square feet, followed by the San Francisco Bay Area with 10.7 million square feet.
While there are localized variations, asking rates are, by and large, holding firm. Although leasing activity is slowly picking up, the gap between asking and effective rents remains significant due to increased concessions on offer.
What’s in store for 2022? There is a growing consensus that the Omicron variant is close to peaking. This should drive an increase in office occupancy later in the first quarter and we expect to see further stabilization occurring in the first half of the year.
The key question will be how to assess the extent that shifts in working practices, business location and space utilization will impact the office sector moving forward. Although remote work will allow some firms to reduce their footprints, others may seek to expand their overall footprint as they account for an evolving office environment and accommodate employees working remotely at flexible workspace locations. However, given existing lease commitments and the time it will take to achieve optimum workplace solutions, it will take several years for all of this to fully play out.

 Marianne Skorupski
 Franklin Wallach
