

 Brennan Yerman
 Franklin Wallach
The Manhattan office market’s Q2 2026 availability rate was 13.0%, the lowest since October 2020, and was well below its peak of 18.2% in February 2024.1 In typical market conditions, an availability rate above 10.0%, or equilibrium, points to a tenant-favored market. However, current market conditions indicate that landlords are in control across numerous pockets, with rising rents, declining concession packages, and increasing competitiveness as tenants look to secure in-demand space.
While the data reflects the full Manhattan office market, a significant portion of supply has struggled to attract a broad range of tenants. Not every segment is experiencing recovery equally, and averages, by their nature, can oversimplify a growing divide between high-performing assets and the rest of the market. The result is a narrowing supply of options, especially in well-positioned and amenitized assets.
Not All Available Space Is Competitive
Manhattan ended June 2026 with 68.10M SF of available space, but with specific filters applied, that supply can be further reduced. First, buildings with landlords contemplating a conversion to residential use account for 2.41M SF of available space. These buildings rarely transact as owners either temporarily pause leasing or tenants are hesitant to occupy space that they may need to vacate shortly after moving in.
Assets in special servicing, which accounted for a further 3.96M SF of supply, also have constrained leasing activity as decision-making authority shifts from ownership to the special servicer, resulting in reduced flexibility and longer approval timelines when engaging and negotiating with prospective tenants. Buildings that are more than a ten-minute walk from the closest subway station also face challenges. For the more than 4 million daily riders on New York City’s subways, those buildings in close proximity to subway stations and major commuter hubs have an inherent advantage over those further away.2 These buildings account for an additional 3.50M SF of availability and have a 31.2% availability rate, which is more than double the Manhattan overall average. Applying just these three parameters reduces Manhattan’s supply to 58.23M SF, or 11.1%, bringing it much closer to equilibrium conditions.
Uneven Recovery Across the Market
Demand picked up significantly over the past year. Manhattan’s leasing activity in the first half (H1) of 2026 totaled 22.80M SF, the strongest H1 leasing demand since 2002. If demand continues at the same pace in H2, it would be the strongest year of leasing velocity since 2000. Strong leasing demand, combined with the emergence of office-to-residential conversions and a dwindling stock of sublet supply – in part driven by return-to-office trends – helped Manhattan record 28.55M SF of positive absorption over the past two years. This included 15.56M SF of positive absorption in 2025, which more than doubled the previous best for a single year. Yet not all pockets of the market experienced increased activity equally.
This was evident in the availability rate by building age. Although the availability rate tightened over the last several quarters across Manhattan’s pre-war (14.7%), post-war (12.6%), and post-1980 (14.3%) inventory, supply in these categories remained above pre-pandemic levels from March 2020. By contrast, Manhattan’s availability rate for post-2000 product was just 6.8%, well below the 10.1% rate in March 2020.3 Tenants that want to lease space in Manhattan’s newest buildings are competing for limited availability, which has led to bidding wars in a few instances.

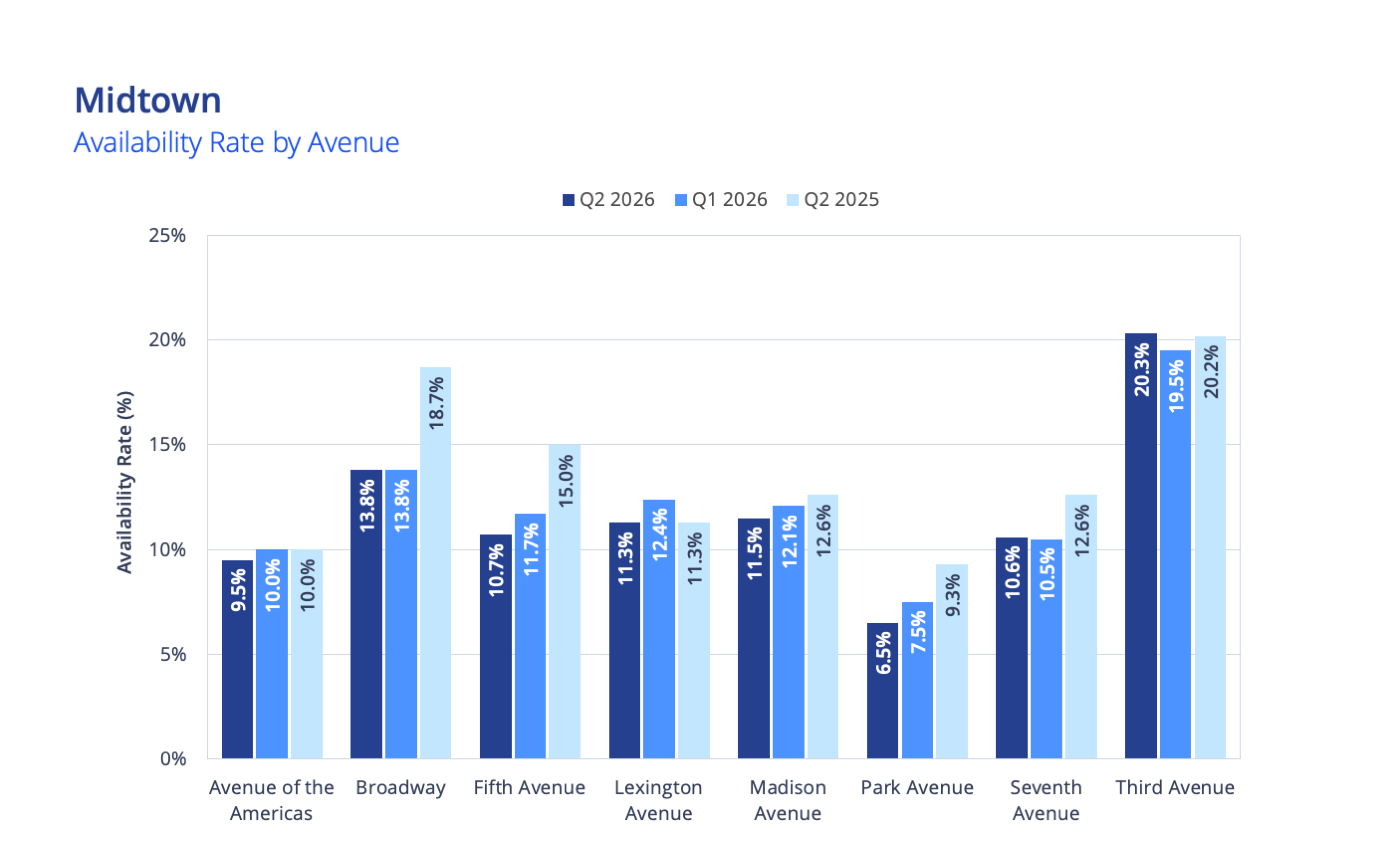
Another divide can be found along the avenues, evidenced by availability rates on Midtown’s prime corridors of Madison Avenue (11.5%) and Park Avenue (6.5%) compared to the less competitive Third Avenue corridor (20.3%).
The average time on market further illustrates Manhattan’s bifurcation. As of June 2026, 19.72M SF of the 68.10M SF of supply, or 29.0% of available space, was vacant for more than three years. Of that total, 10.44M SF of available space (15.3% of overall availability) was vacant for more than five years. This is not typical for the Manhattan office market. In Q4 2019, when there was a similar level of demand, only 6.22M SF of the 52.24M SF of space (11.9% share) had been available for more than three years, and 2.37M SF of space (4.5% share) was vacant for more than five years. Manhattan’s recovery has not been felt equally across the board, helping explain why availability may appear artificially tighter than it actually is. Tenants are disregarding a larger portion of supply for various reasons, though this could start to shift if supply continues to dwindle.
Pricing Power Is Shifting Back to Landlords
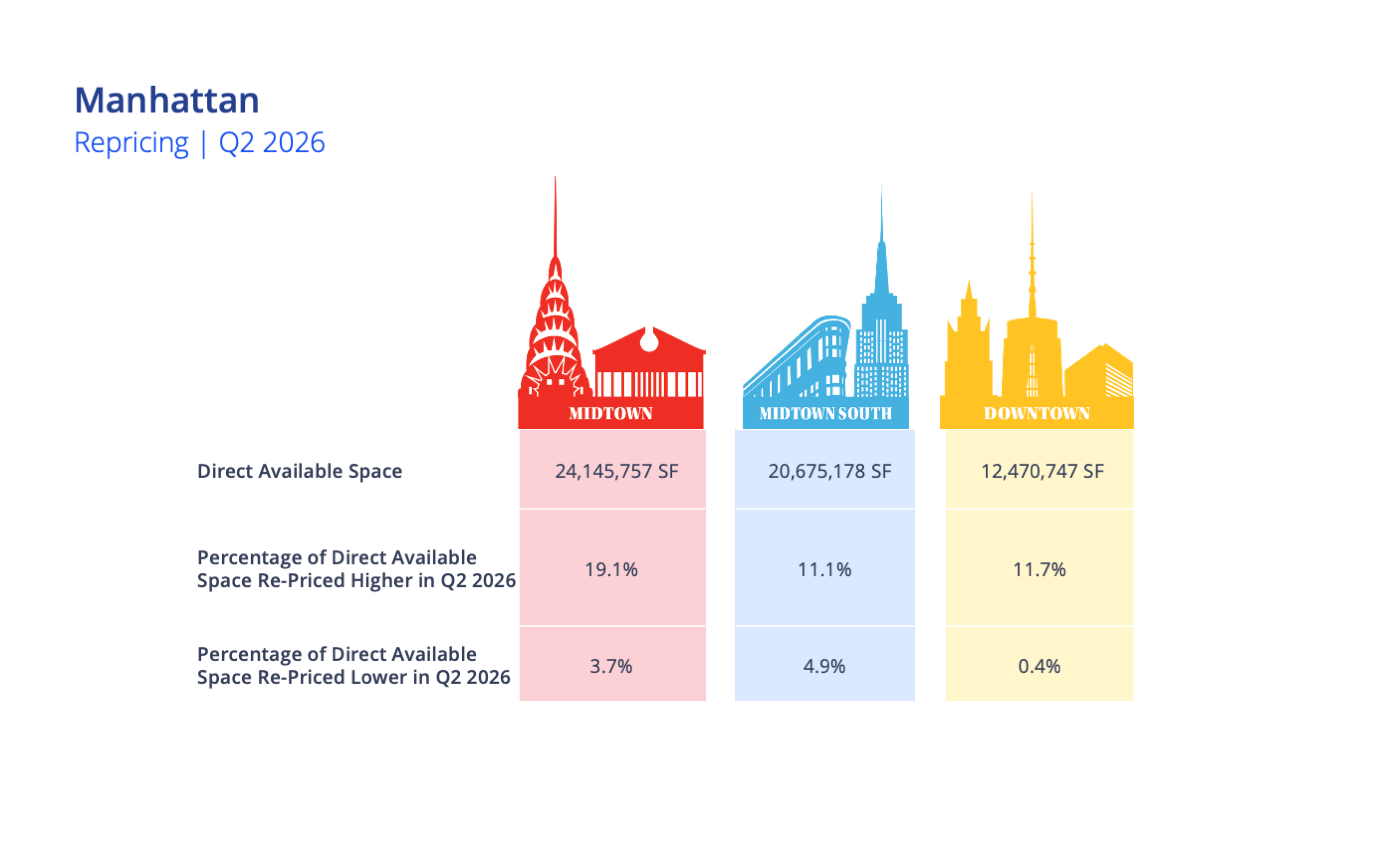
As availability continued to decline, several key indicators have shifted in favor of landlords. One of the most significant is the higher repricing of direct available space. During the second quarter of 2026, instances of higher-repricing far outpaced lower-repricing across every Manhattan market. Midtown had the widest spread, with 19.1% of direct space being repriced higher compared to just 3.7% lower. Midtown South and Downtown saw narrower spreads: 11.1% higher vs. 4.9% lower in Midtown South and 11.7% higher vs. 0.4% lower in Downtown.
Declining concession packages, particularly within free rent, further reflected this shift. The H1 2026 weighted average rental abatement period for new deals was just 12.4 months, the lowest since 2019.3 Furthermore, tenant improvement (TI) allowances have largely plateaued. Manhattan’s H1 2026 average TI allowance for new deals was $140.02/SF, comparable to the full-year 2023-2025 averages which ranged from $137.98 to $141.19/SF. However, increasing construction costs could be masking underlying changes. These trends point to a market where landlords are regaining pricing power and reducing reliance on historically elevated incentive packages.
Value-plays Are Still an Option
As of June 2026, the Manhattan office market still had a surplus of availability compared to the pre-pandemic total. This was especially the case for tenants looking for value-play or otherwise less-competitive options. However, for tenants who wanted premium space, conditions were much tighter.
When just a few filters are applied, such as potential conversion, distance from subway stations, and ownership-related financial constraints, a significantly lower effective supply is revealed, helping explain why market conditions have felt tighter than the headline availability rate. However, this represents only part of a broader dynamic in the market. The factors that drive decisions among tenants vary widely – such as Central Park views, tenant-only lounges, LEED certifications, express elevators, proximity to clients or other key companies – and can further reduce the available options. These factors continue to evolve, further shaping tenant decision-making across Manhattan.
1 The availability rate is based on actively marketed space scheduled for tenant build-out or possession within 12 months.
2 Source: MTA; data reflects typical weekday ridership as of June 16, 2026
3 Average based on direct deals with 5+ year term and over 5,000 sq. ft.

 Rachael Rothman
 Marianne Skorupski