Brennan Yerman
 Colliers Insights Team
- Manhattan availability ended Q2 at its lowest level since January 2021.
- Sublet supply is tightening, with Midtown South returning to below pre-pandemic levels.
- A flight to quality is clearly apparent, with buildings delivered after 2000 posting an availability rate of 8.5%.
- Rents are showing signs of strength, with higher repricing seen at a rate more than 2X price reductions in Midtown and Downtown.
- Concessions are stabilizing as well, setting the stage for better investment sales opportunities.
Manhattan’s availability rate dropped again during the second quarter of 2025, falling by 0.7 percentage points to 15.4%, the lowest level recorded since January 2021. At 81.98 million SF, the total available supply has declined by nearly one-sixth since the post-pandemic peak in February 2024. However, availability remained more than 50.0% higher than in March 2020.
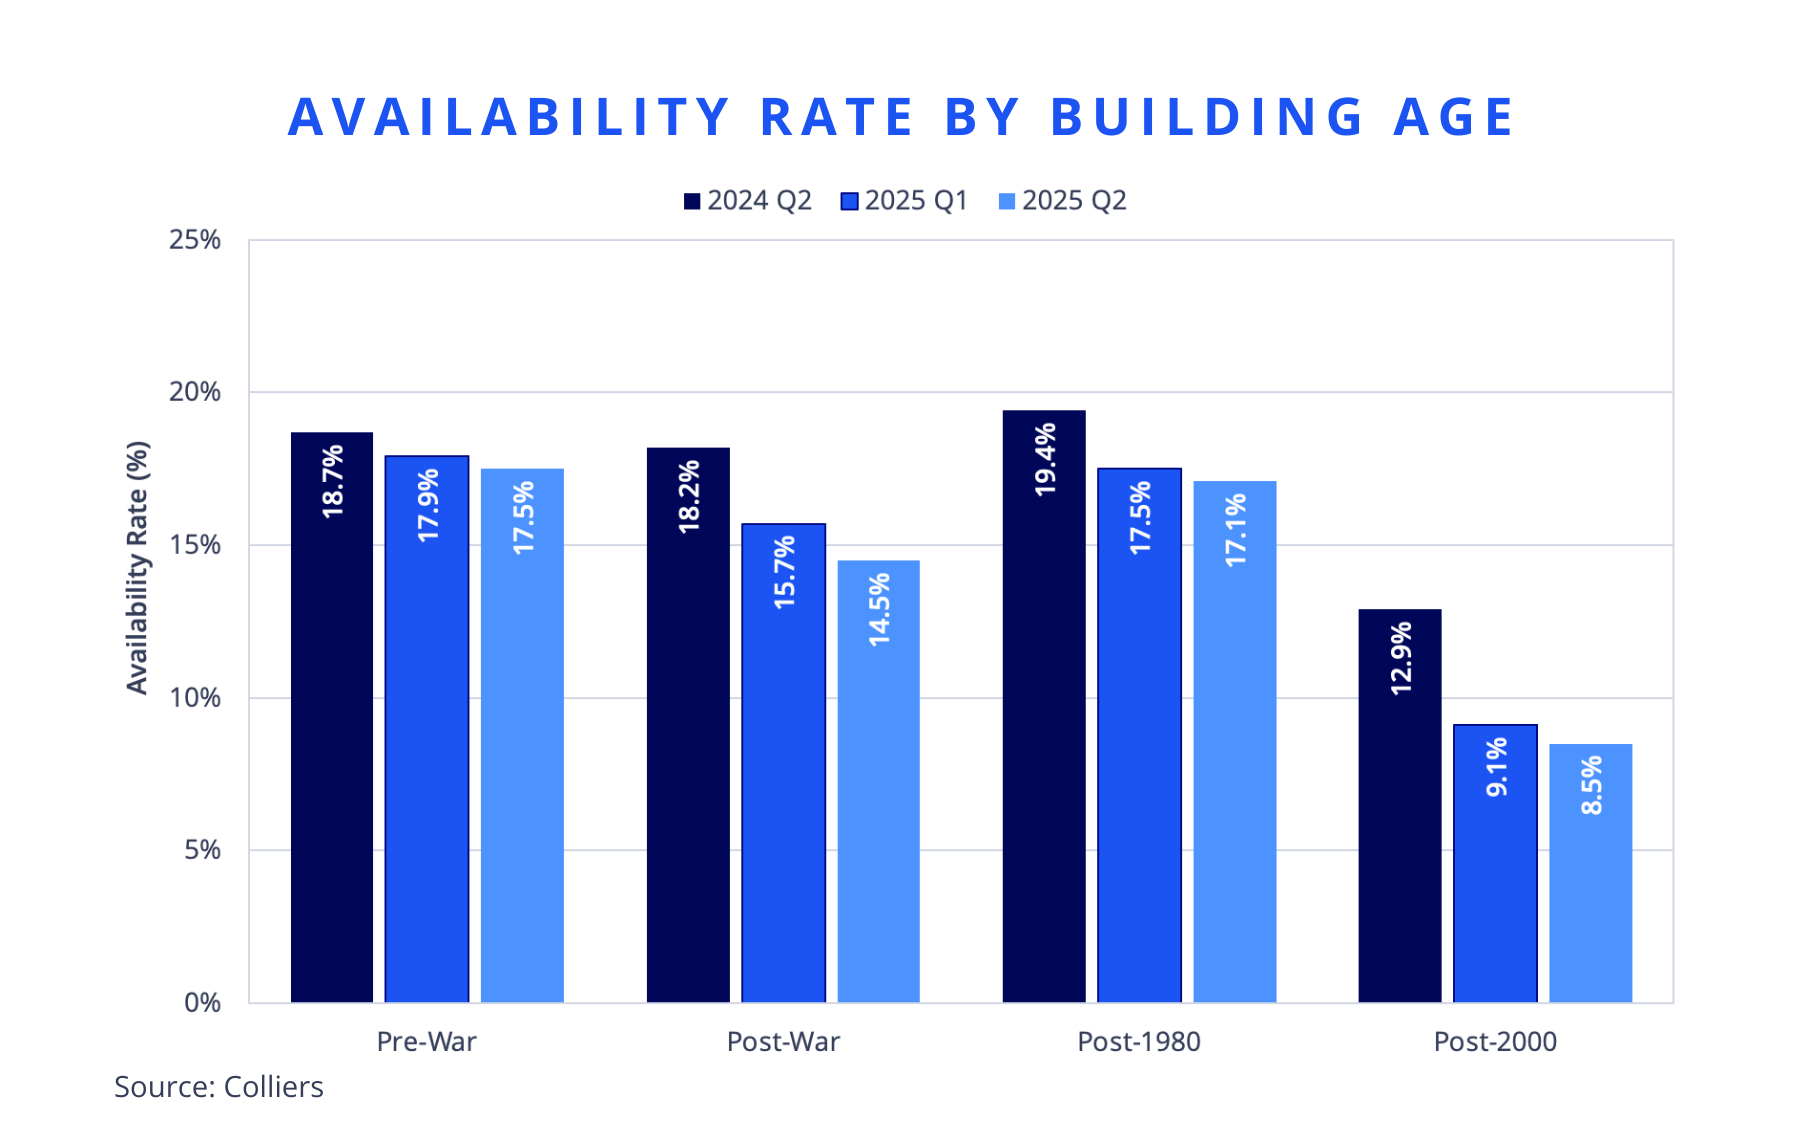
One of the key drivers behind this decline was the reduction in sublet availability. Since the post-pandemic peak in March 2023, Manhattan sublet supply has dropped by 37.2% to 13.89 million SF, its lowest total since July 2020. During the second quarter, Midtown South became the first Manhattan market to return below its pre-pandemic supply level, falling by 600,000 SF to 3.66 million SF. Another contributor was the decrease in post-2000 availability over the last 12 months, which declined from 12.9% to 8.5%, as tenants continued to gravitate toward the highest-quality spaces. In Midtown, post-2000 supply was even more constrained, down to 6.7%, the lowest rate since June 2019. Availability tightened year-over-year across all age groups in Manhattan. Additionally, tenants seeking space along the more in-demand avenues in the core of Midtown also faced limited options, with Park Avenue availability falling from 10.6% a year ago to 9.3% in 2025 Q2, matching its lowest rate since 2019 Q2.
At the same time, demand is improving. Through H1, Manhattan leasing activity totaled 20.63 million SF, putting the market on pace to surpass 40.00 million SF of total activity for the first time since 2019. This total was bolstered by exceptionally strong first-quarter activity. The 11.39 million SF of velocity in Q1 represented the highest level of first-quarter demand since 2014. Meanwhile, rents are showing signs of improvement, with an uptick in higher repricing of direct space. During the second quarter, instances of higher repricing more than doubled those of lower repricing in Midtown and Downtown.

An emerging trend in the Manhattan office market is the plateauing of concession values over the last two years. The combined average weighted value of tenant improvement allowance and free rent for new deals from 2023 to 2024 rose by just 0.1%, the smallest year-over-year gain since 2019, when concessions fell by 9.9%. Through H1, combined concessions for new deals dropped by 11.1% since 2024. If they hold at the same rate for the remainder of the year, it would mark the largest annual decline in concessions since 2012, at 30.1%. Still, the H1 combined concession value of $230.56/SF for new deals remained 46.7% above the pre-pandemic total and was nearly double the figure from a decade ago at $122.05/SF.

 Steig Seaward