
- Full-time employment has fallen since November. Meanwhile, part-time jobs continue to grow.
- On net, jobs levels are down per the household survey.
- This data trend diverges from the monthly job data the payroll survey suggests.
- A softening job market supports future Fed rate cuts.
- Recognizing changing job dynamics can aid in real estate portfolio management.
The Bureau of Labor Statistics (BLS) releases two different employment surveys. The most frequently cited is the payroll survey, which typically comes out on the first Friday of the month. This survey is based on nonfarm employment. Per this survey, March job data accelerated to 303,000, and jobs have been rising at a steady clip month after month. At the same time, the BLS releases a household survey, which is where the unemployment rate comes from. This survey is a broader look at employment and includes agriculture and self-employment. Each series is slightly different, and recently, the data is diverging. The payroll survey shows a gain of 1.1 million jobs since November. In contrast, the household survey indicates a decline of 187,000 jobs over the same period. Job losses may influence the Fed’s interest rate decisions at upcoming meetings, supporting cuts.
 Aaron Jodka
Employment data is diverging. A softening job market supports future Fed rate cuts.
Part-Time Jobs Are Growing, Full-Time Are Not
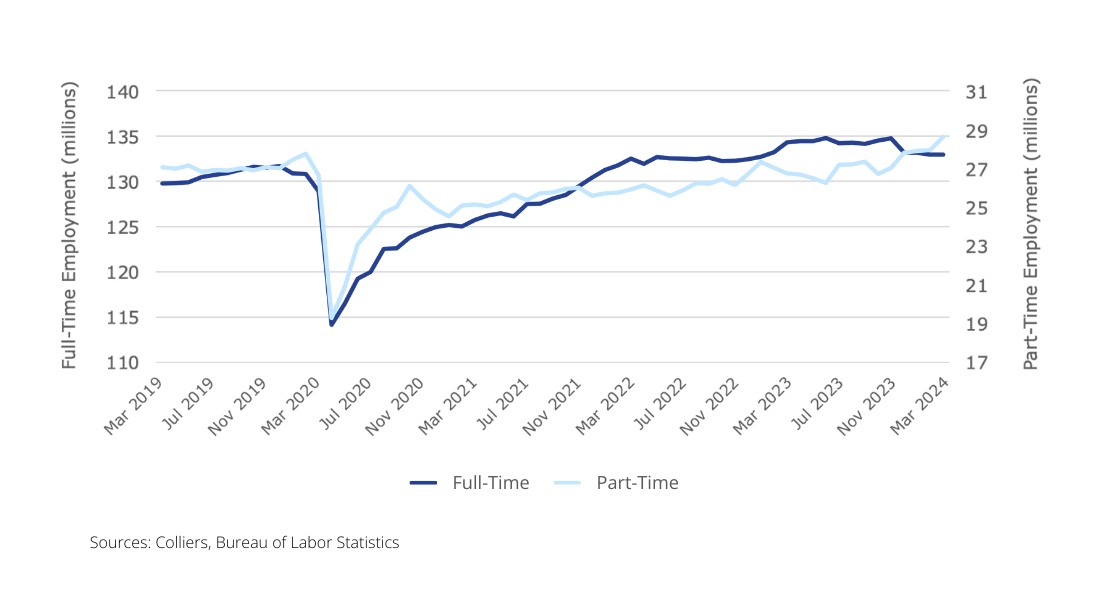
The chart above looks at the household data for full-time and part-time employment. In recent months, the full-time series has been falling, off nearly 1.8 million jobs since November. At the same time, part-time jobs have been rising, up 1.6 million. This trend suggests that the job market is cooling, and the pivot from full-time (read: higher-paying jobs) to part-time work could put downward pressure on inflation, if not the economy overall.
Broad economic growth is more complicated than just jobs. Recent immigration statistics show higher population gains than initially expected; this could be a factor in supporting employment and, in turn, economic activity. The point is the job numbers are an indicator.
It’s important for real estate owners to pay attention to the nuances in the two data series and understand when and where divergences are happening. These trends could indicate further pressure on some real estate sectors while aiding others.