 Steig Seaward
Pricing trends and transaction activity continue to shape how the market evolves. At Colliers, we analyze these signals to interpret shifts across U.S. commercial real estate. Here’s what the latest MSCI data reveals.
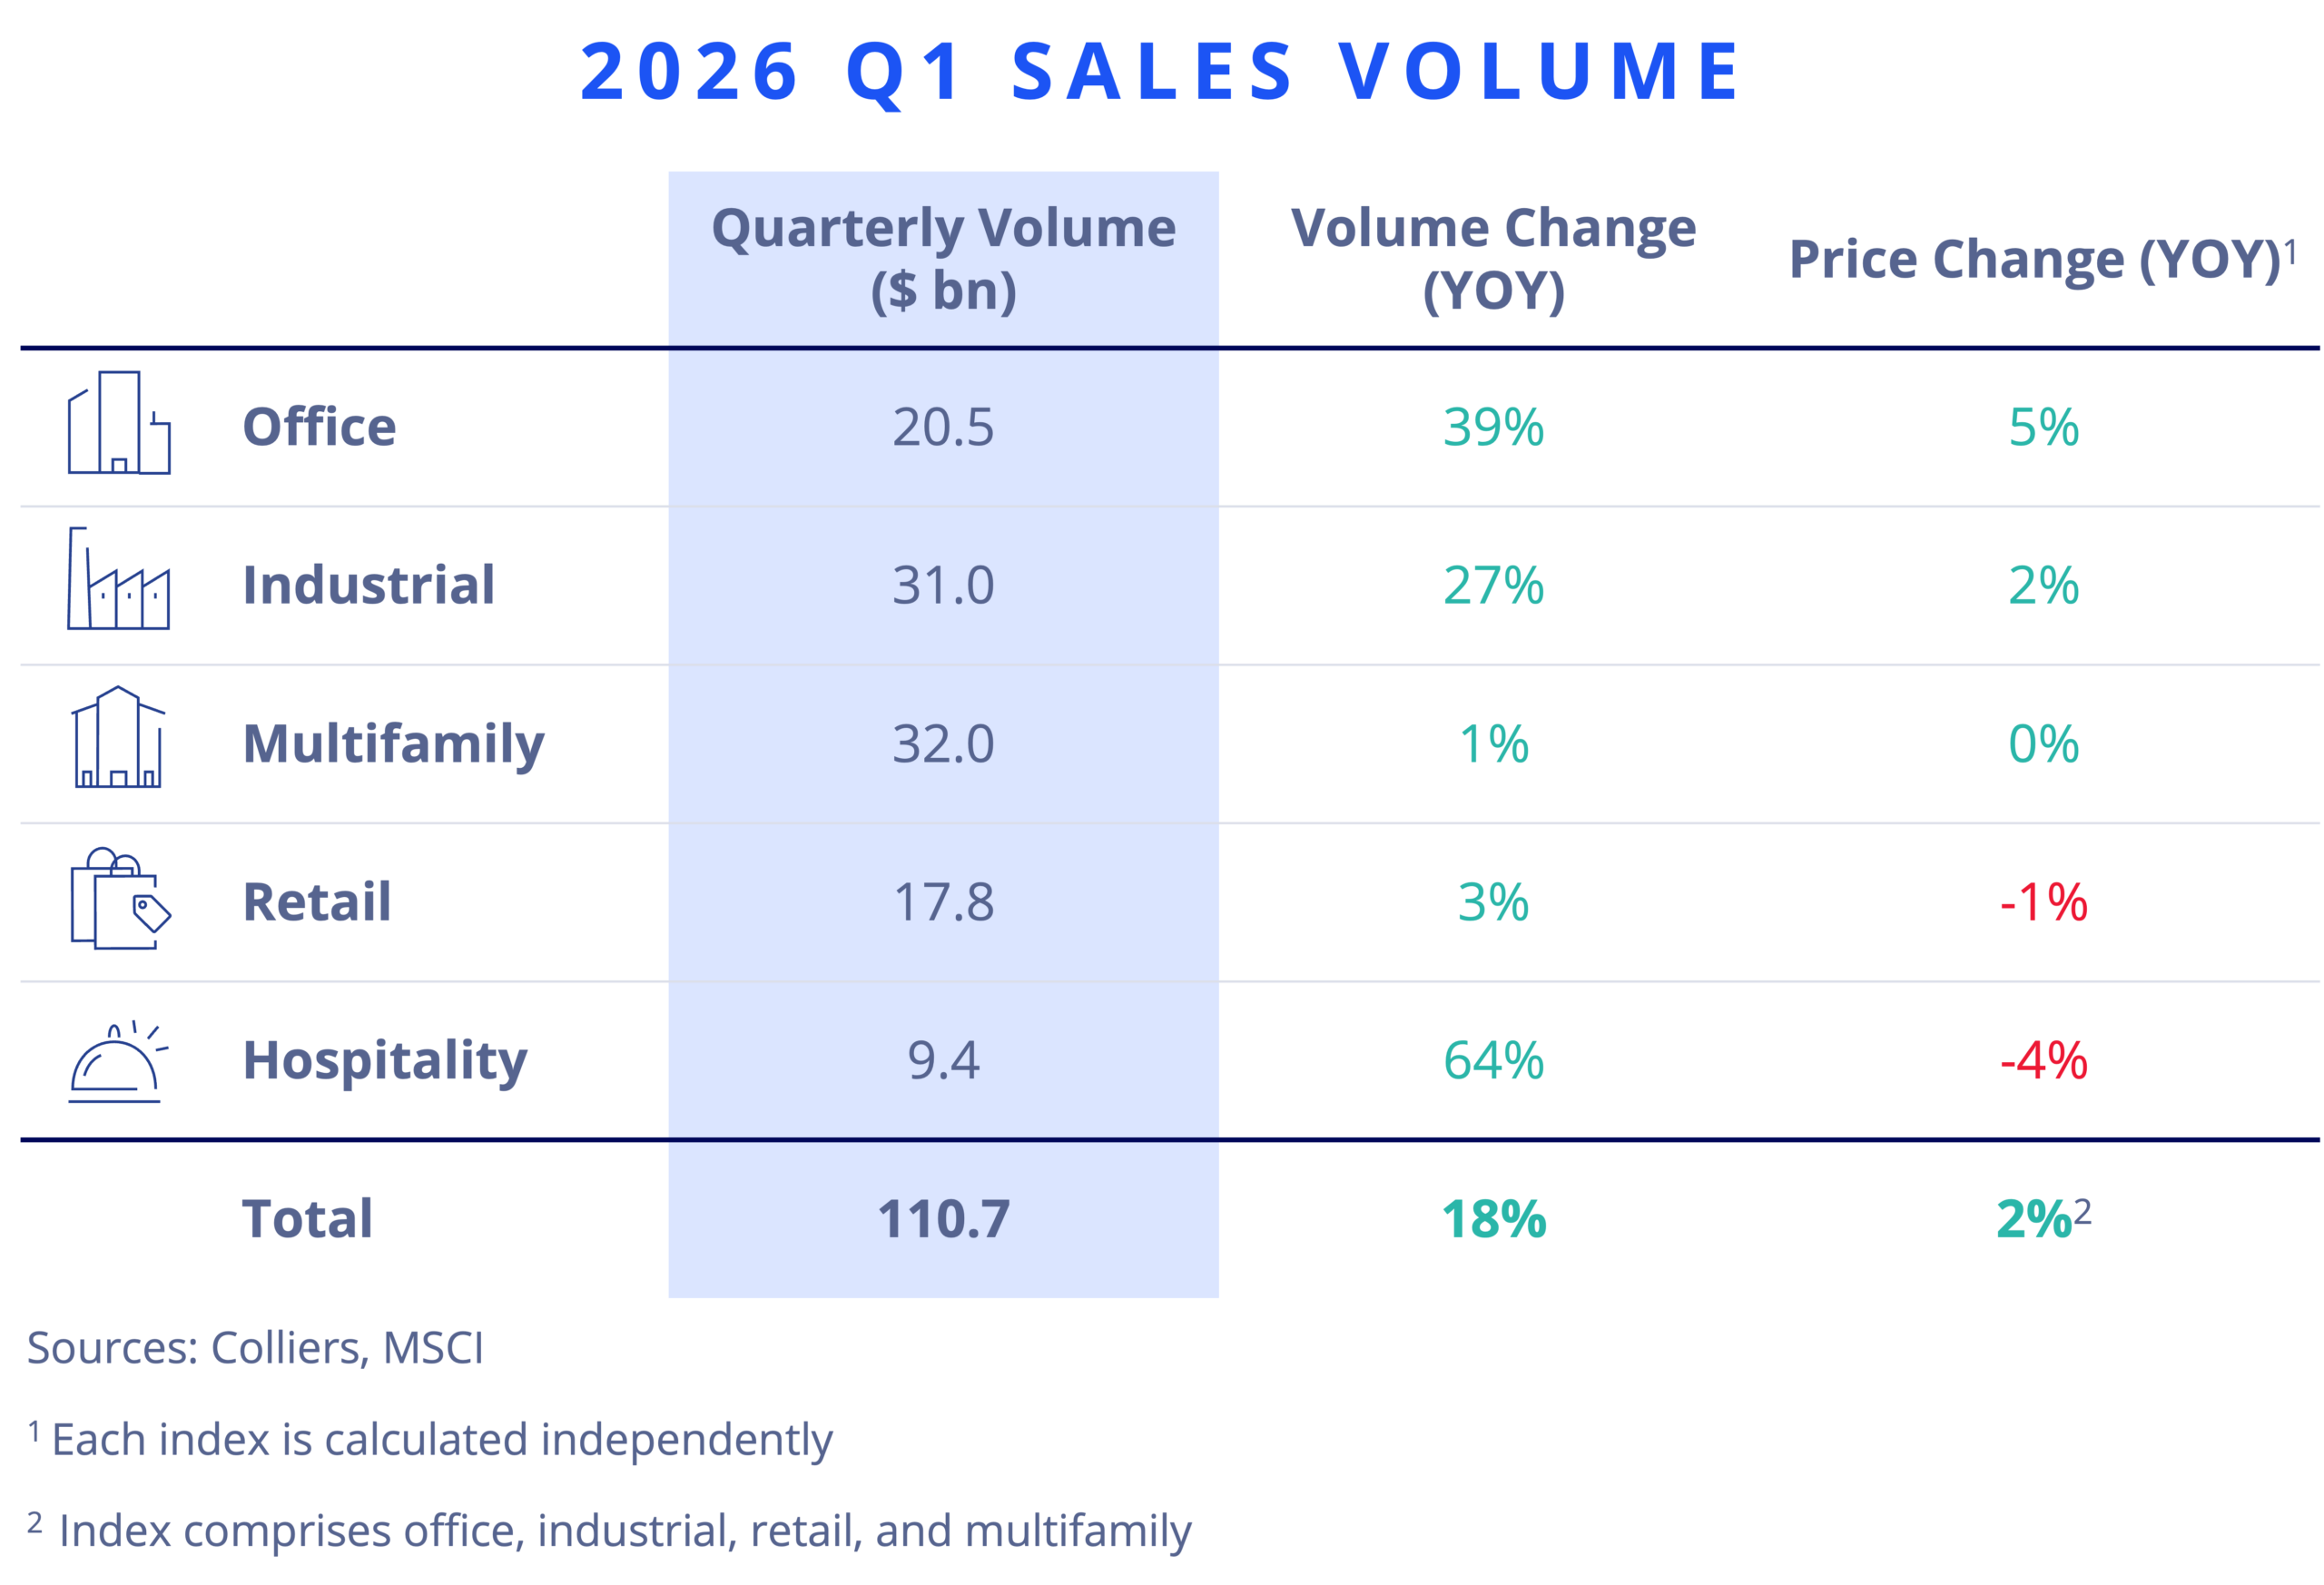
- Investment volume reached $110.7 billion, up 18% year over year, extending the recovery that began in mid-2025.
- Single-asset transactions continued to anchor liquidity, while portfolio and entity deals reemerged selectively, including several take-private transactions involving publicly traded REITs.
- Industrial and multifamily led total volume, while office and hospitality joined industrial in posting the largest annual gains.
- Pricing remained mixed as cap rates drifted higher, reinforcing the need for disciplined income-focused underwriting.
Office
Office investment activity strengthened in Q1, with $20.5 billion in transactions, up 39% year over year, driven by improved single-asset deal flow and the return of entity-level activity for the first time in two years. Suburban markets continued to lead volume growth, while CBD activity improved at a measured pace amid uneven pricing trends. Cap rates rose across the sector, but increasing transaction volume suggests buyer and seller expectations are gradually converging despite ongoing uncertainty about long-term office demand.
Industrial
Industrial remained one of the most liquid sectors, recording $ 31 billion in Q1 volume, a 27% year-over-year increase, as deal activity broadened across warehouse and flex assets, geographies, and structures. Pricing continued to outperform the broader market on an annual basis, though cap rates edged higher, particularly for flex product, reflecting more selective underwriting rather than waning appetite. Warehouse assets continued to attract capital at relatively stable pricing, underscoring industrial’s core status.
Multifamily
Multifamily investment totaled $32 billion in Q1, essentially flat year over year, but underlying signals improved as individual asset sales rose 3%, indicating growing confidence in property-level underwriting. Portfolio and entity activity remained muted, especially outside major metros, while pricing declines paused for the first time since late 2022. Cap rates drifted modestly higher and geographic divergence persisted, with major markets outperforming as investors focused on income durability and market selection.
Retail
Retail transaction volume reached $17.8 billion, up 3% year over year, a modest headline gain shaped by slower portfolio and entity activity. Beneath the surface, single-asset transactions surged 35%, extending a multi-quarter trend of strengthening property-level liquidity, particularly for shopping centers. Pricing remained mixed but stabilized sequentially, while cap rates edged lower, signaling increasing investor comfort with well-located, necessity-based formats relative to shop space.
Hospitality
Hotel investment activity rebounded sharply, with $9.4 billion in transactions, up 64% year over year, driven primarily by portfolio and entity-level sales that lifted headline volume. Single-asset deal flow remained essentially flat, reflecting continued selectivity at the property level. Pricing stayed under pressure and cap rates held steady, highlighting an uneven recovery in which liquidity is returning faster than operating performance.